Arrow
Arrow is a very powerful visual tool for better storytelling. When dropping an arrow element in the convas, you can drag and drop any end of the arrow to reposition it.
In an arrow setting, you can customize it for styles like solid/dash line, line thickness, arrow heads and head shapes, and color.
Shadow
You can also use it to hightlight horizontal or veritcal area by using shadow option.
Label
Arrow supports Label so that you can easily to add a marker with label content to explain some specific data point. In the label setting box, you can customize its background, title and its auto-wrap text content.
Marker
Marker is a special arrow for data point marker purpose, as described above in label section.
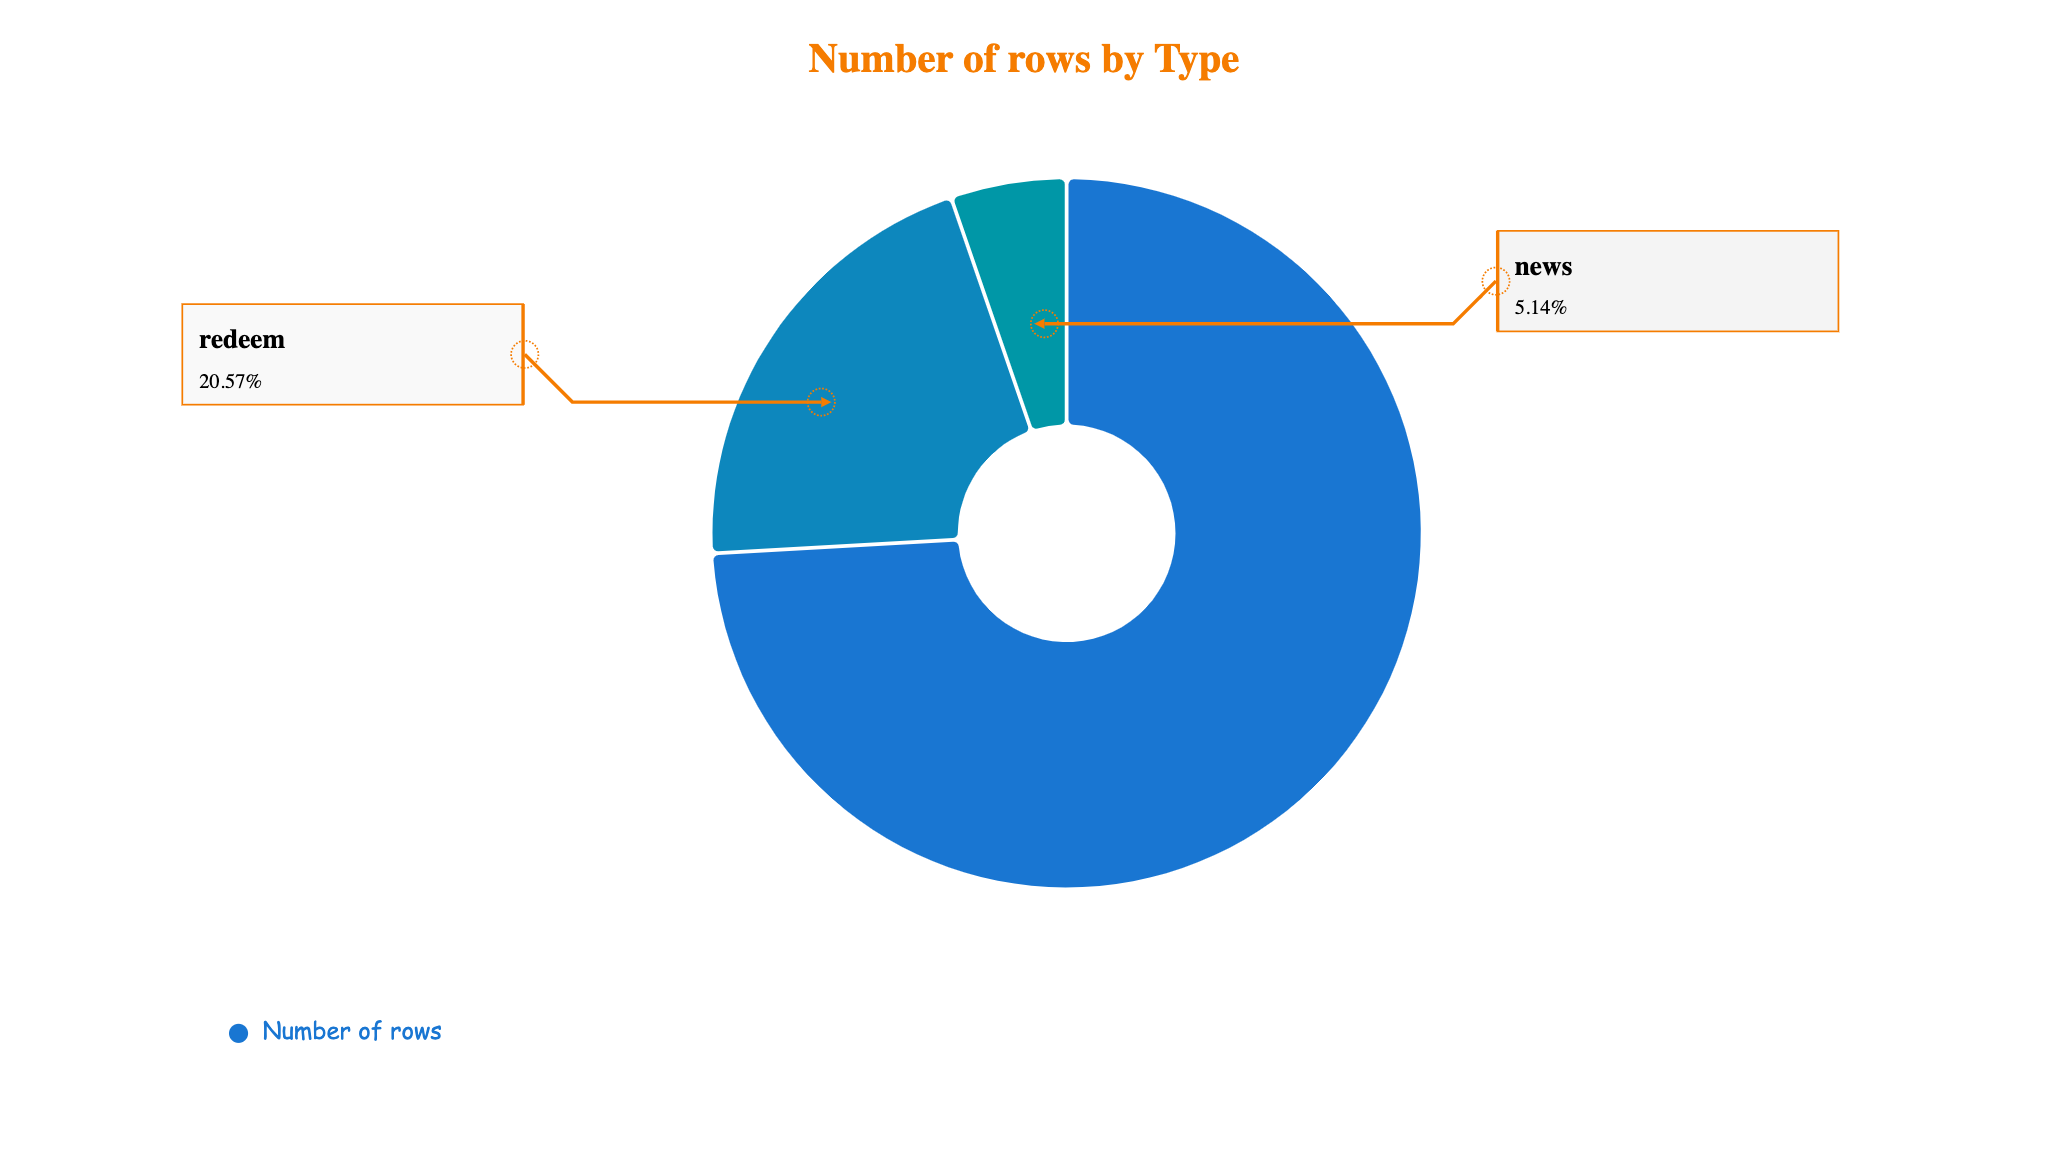
The Auto label is powerful, it automatically populate the data point values into the label box when you drag the end point into a data area, currently only Line/Area and Pie charts support it.
for example: