Map
Working with map is super simple and straightforward on Columns. As long as geo location info is found in your data, supported map should be automatically rendered for your further design.
Supported maps
Currently, only US map and World map are supported in 3 rendering types: Spike, Bubble, and Choropleth.
We're working on bringing other maps into the system, including other countries and worldwide map, this doc will be updated once it's ready.
Map anatomy
Firstly, map is rendered by location key, if related map info is detected, it will load proper map to render it.
In US map, this includes:
- State name: short name or full name, column value like
WAorWashingtonare valid state names. - State code: US state code
- Zip code: 5 letter of zip code, for example
98033, when ZIP code detected, a county/city level map will be rendered. - City name: just city name, render city level map when detected
- County name: just county name, render county level map when detected
- County code: 5 letters of county code, render city level map when detected
- County code-3: 3 letters of county code, render county level map when detected.
For world map, this includes:
- Country name: official name or short name, column value like
United StatesorUSare valid country names. - Country code: 3 letters of country code, for example
USA,CHN. when country code detected, a country level map will be rendered.
In below, example, the column 'state' carries state short name, hence US map rendered at state level
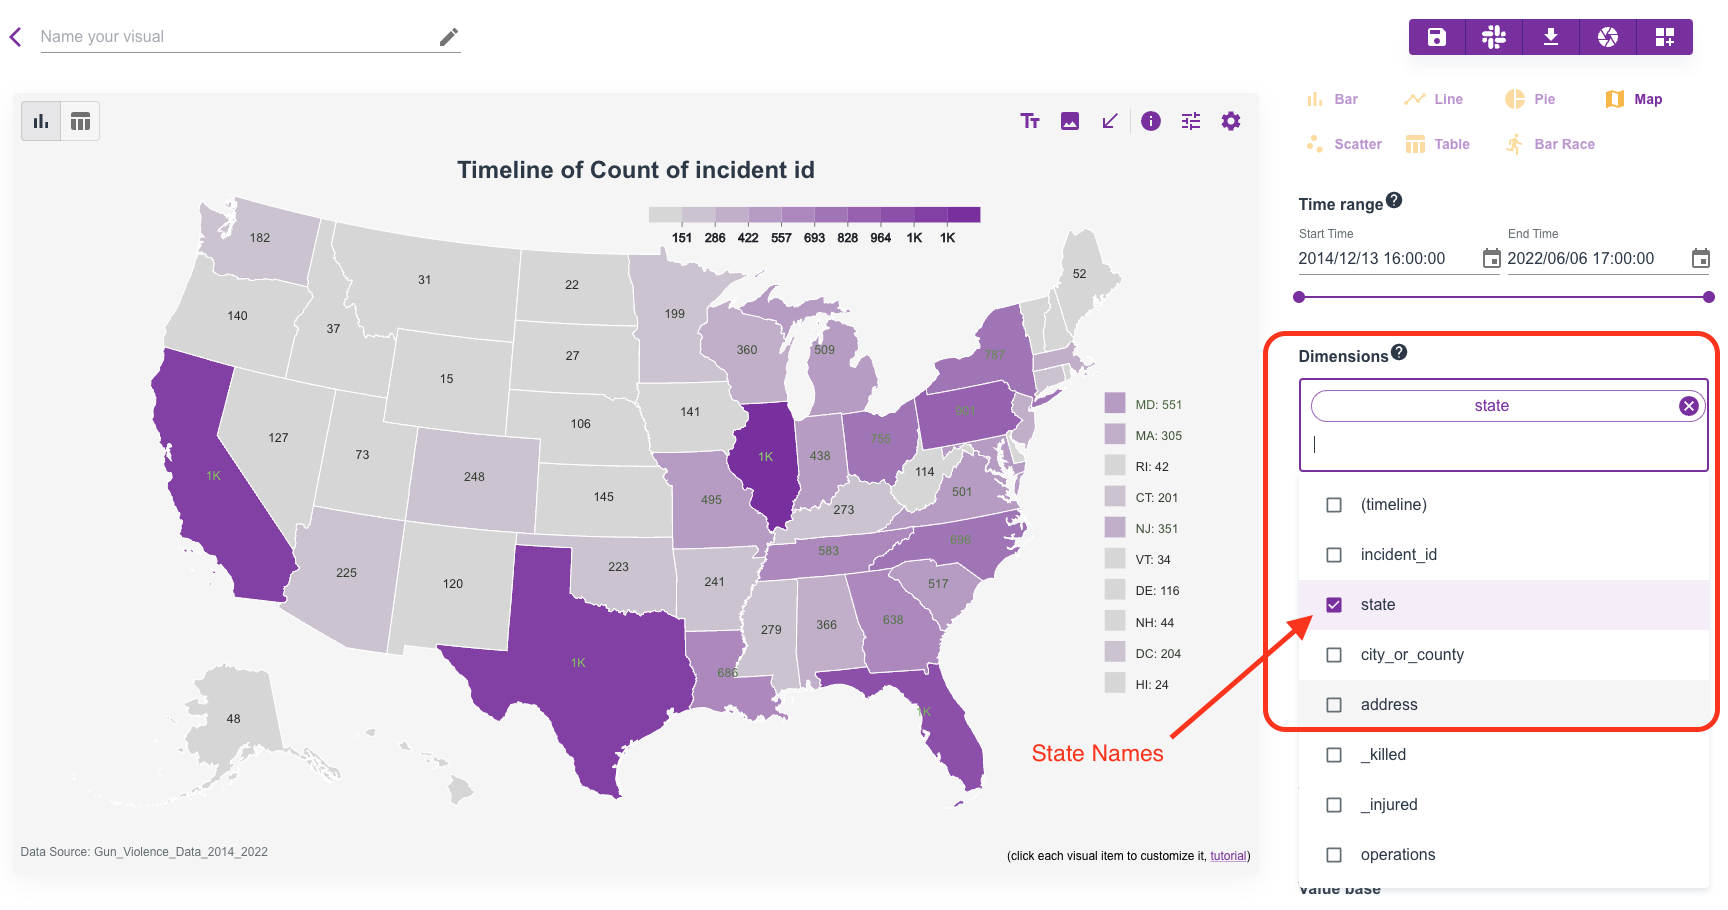
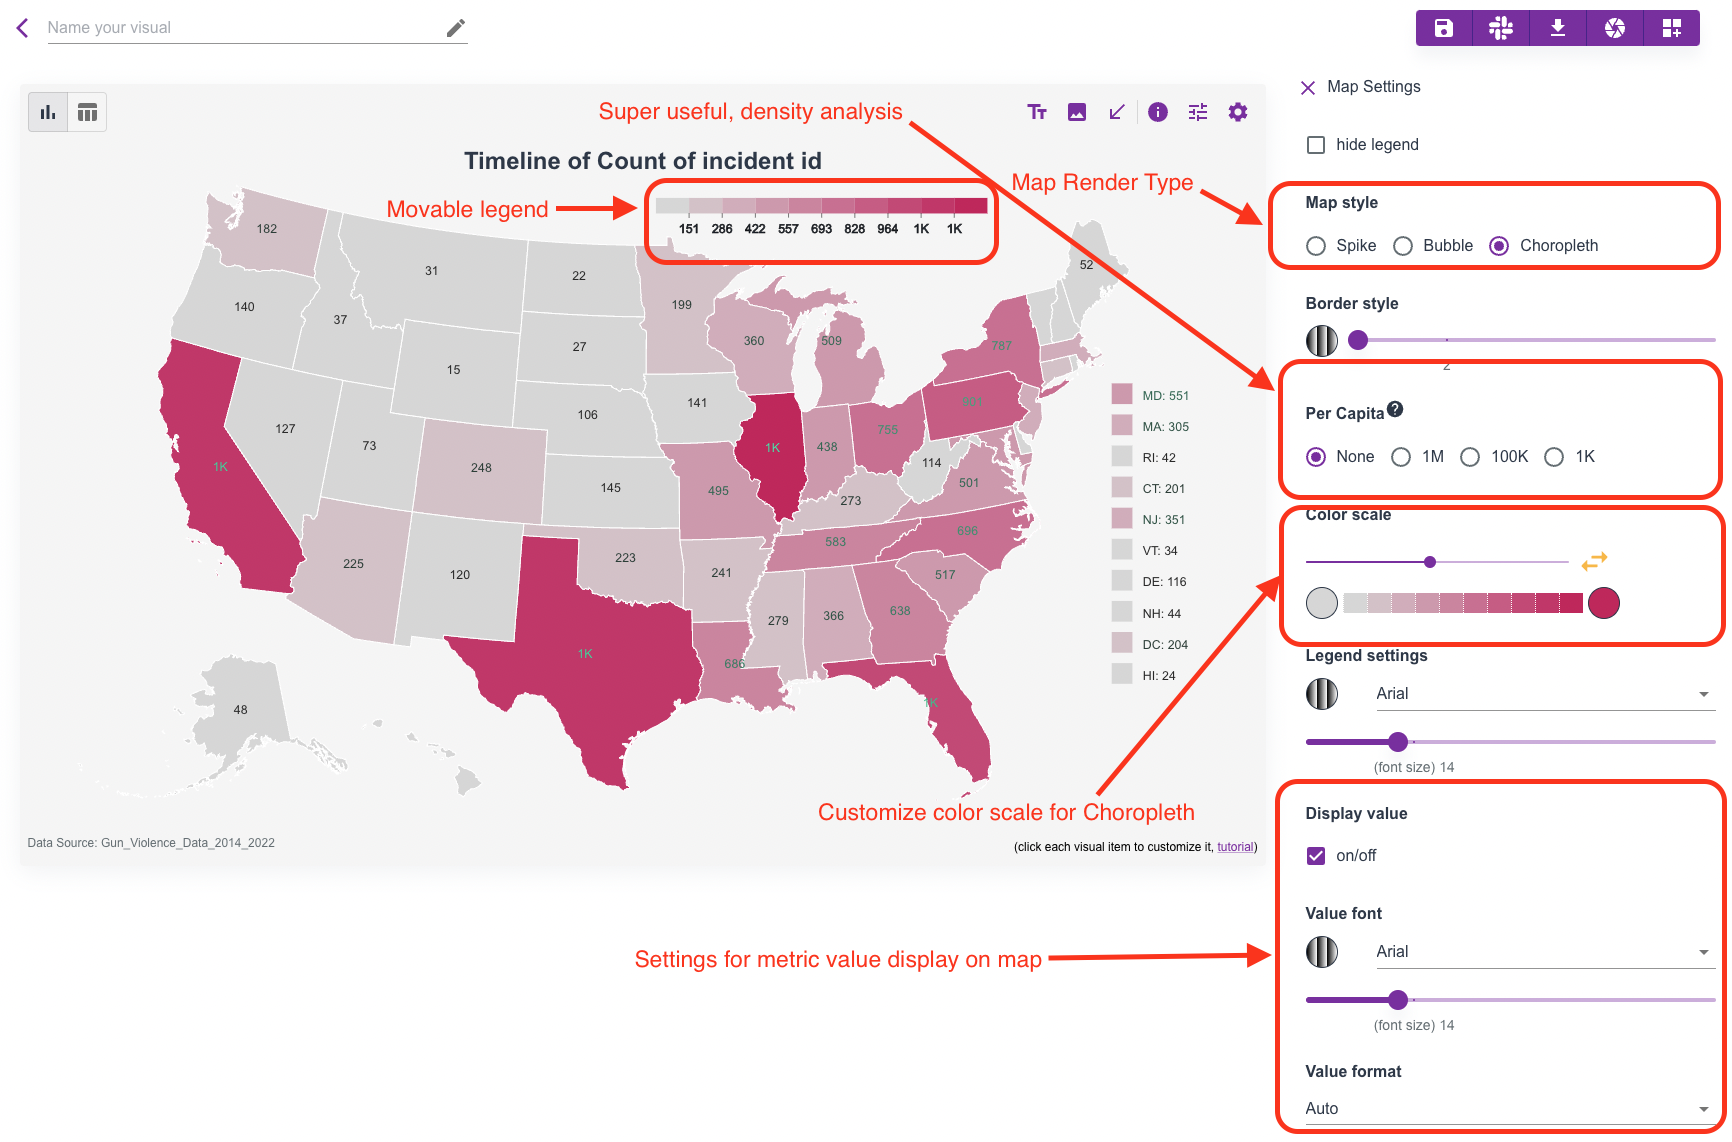
Secondly, there are a bunch of options that you can customize the map.
By clicking the map itself, its settings shall show up on the right side, take a look at the anatomy picture:
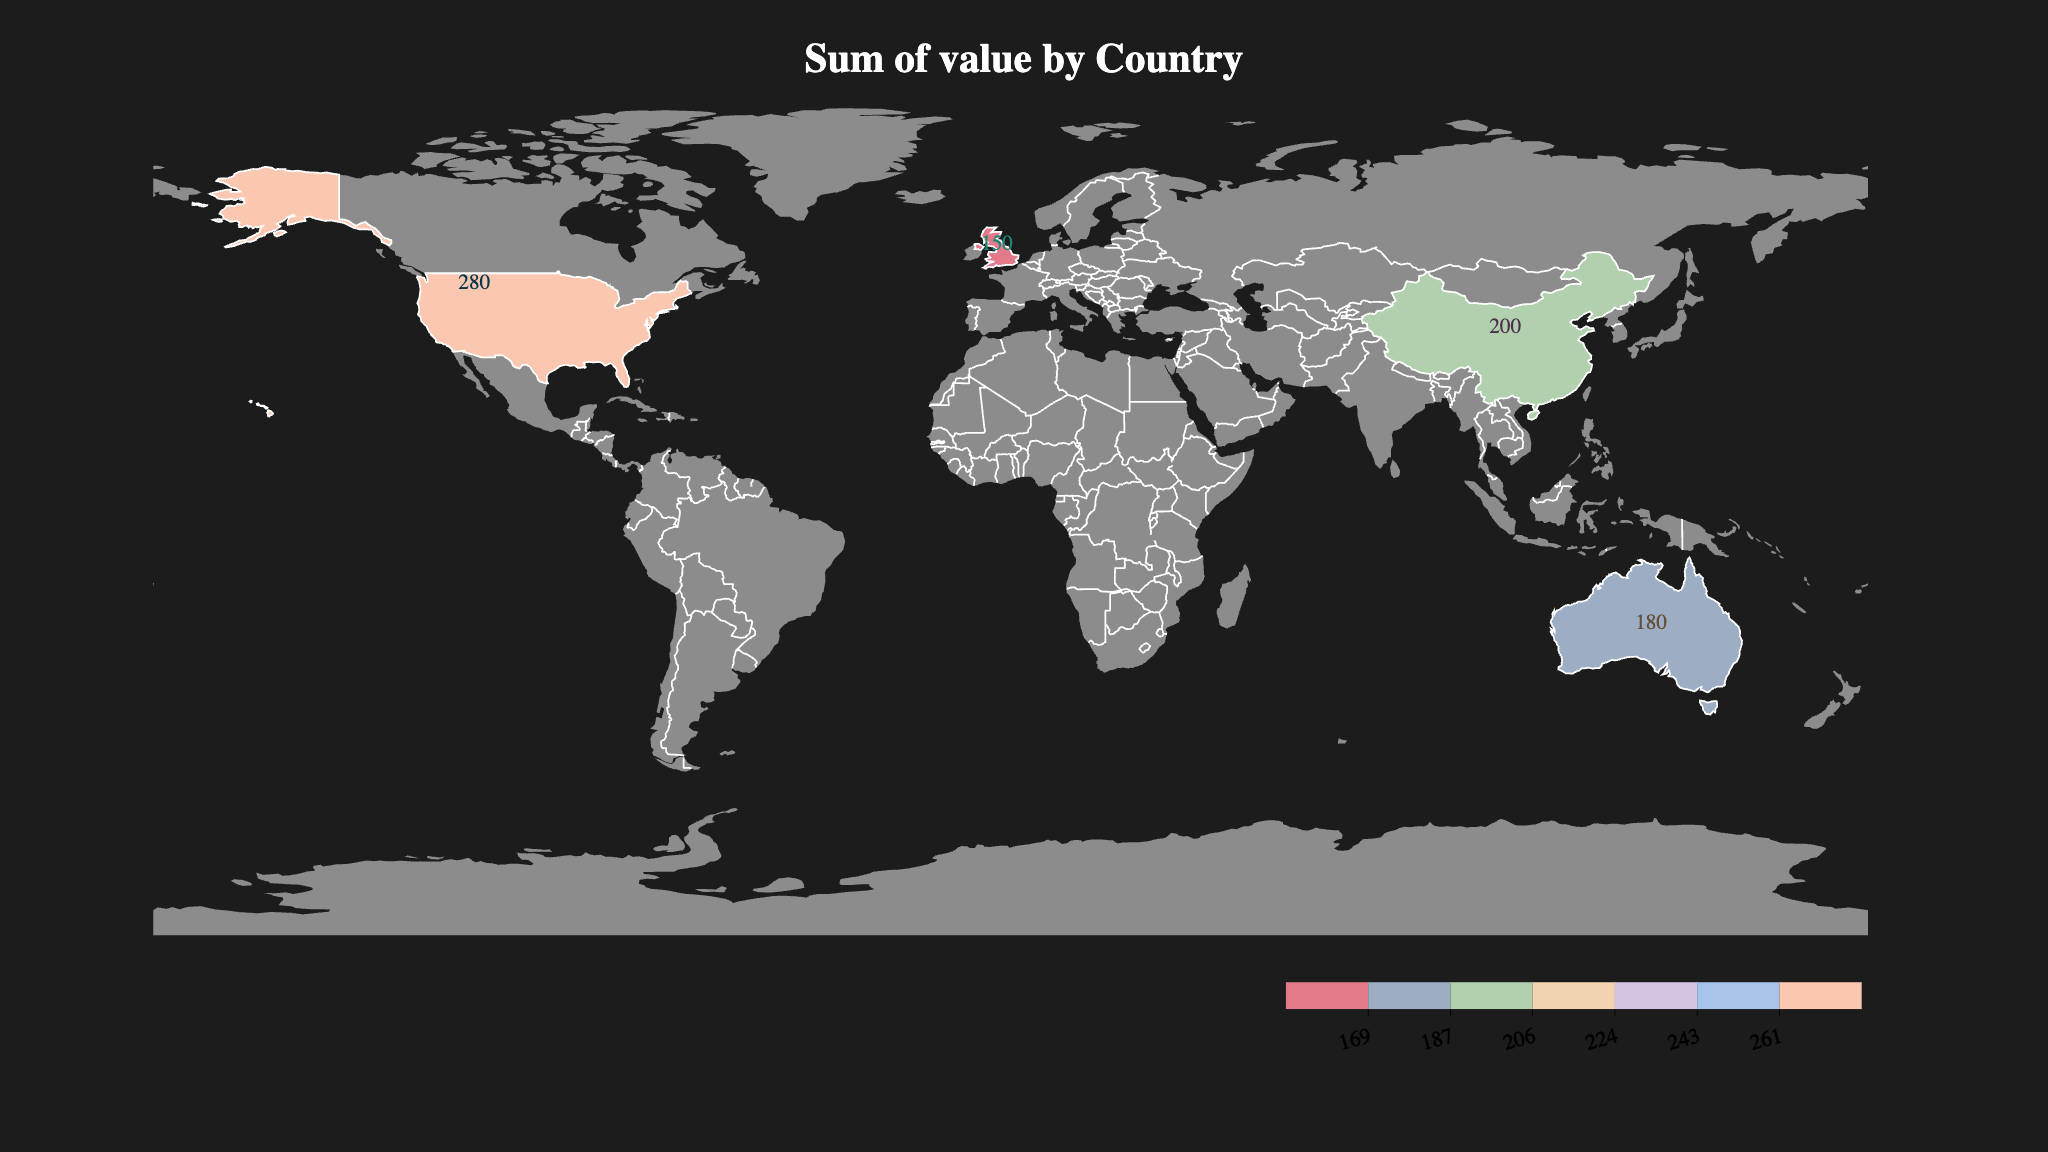
World map example:
Data example with country codes.
Per capita
In above settings, you may have noticed that, we have options for you to quickly get per capita analysis.
This is very convinient since people find it's more meaningful when looking at density value on the basis of its population rather than raw values.
Here we present the most common options - 1M (metric per 1 million people), 100K (metric per 100,000 people), and 1K (metric per 1000 people).
Population data: Columns fetches the latest population data from public service to ensure it's update to date.
Note: Per capita is only available for US map currently.