Timeline
Timeline is useful when working with time series data. Columns provides many special customizations for timeline data analysis:
- Flexible time window adjustment.
- Forecasting all metrics for the future.
NOTE: Timeline features are only available for Time Series data, you need to turn it on when importing your data. Not all data has time value column hence it may not be used as time series data.
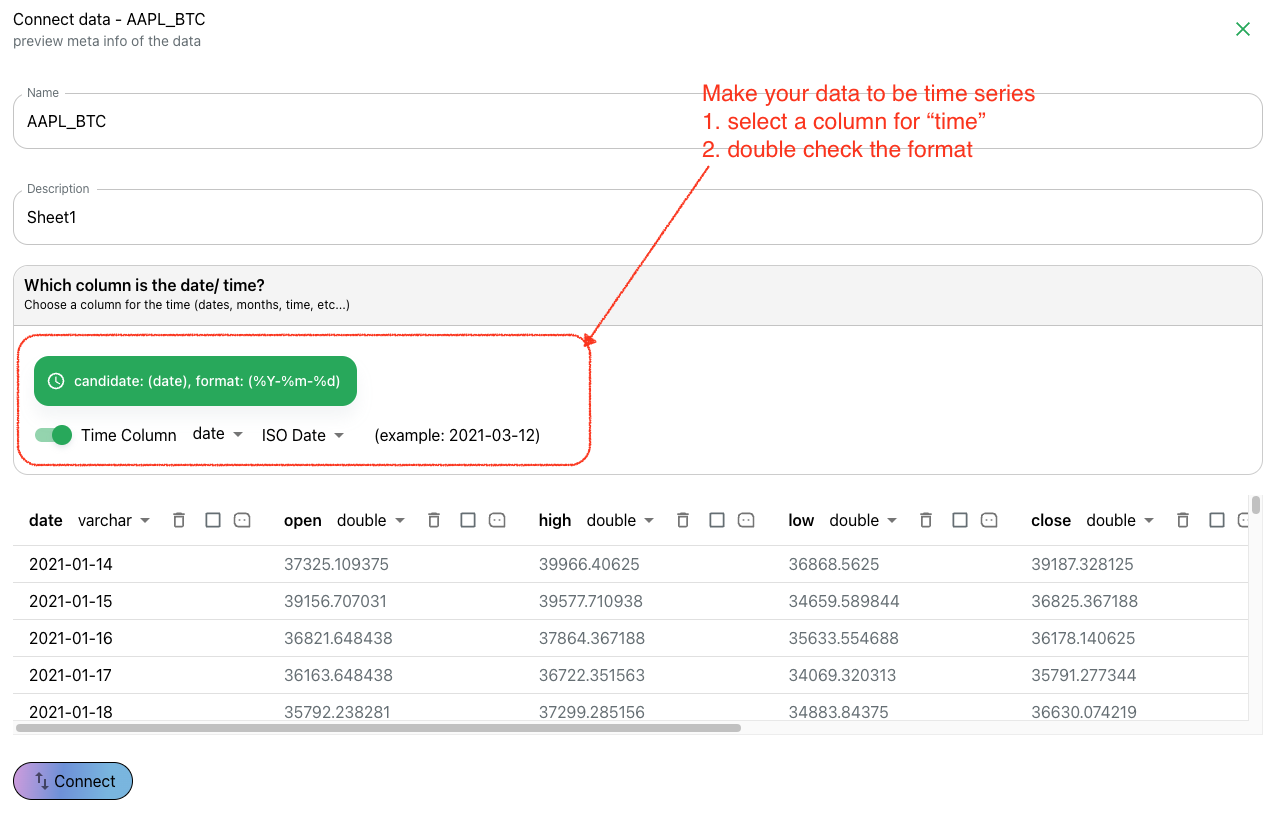
Enable time series for a dataset
When you establish a new data connection, you have an option to enable it to be time series data. In below illustrated option, you should specify the column name and its time value pattern:
Visualize timeline
Columns produce timeline by default when analyzing a time series data. And there are special settings in place to adjust timeline, such as window or filling 0 for missing time point.
Talking about window, it is easy to adjust timeline to produce view of a specific time unit, like daily, weekly, monthly, quaterly or yearly. As illustrated in below example:
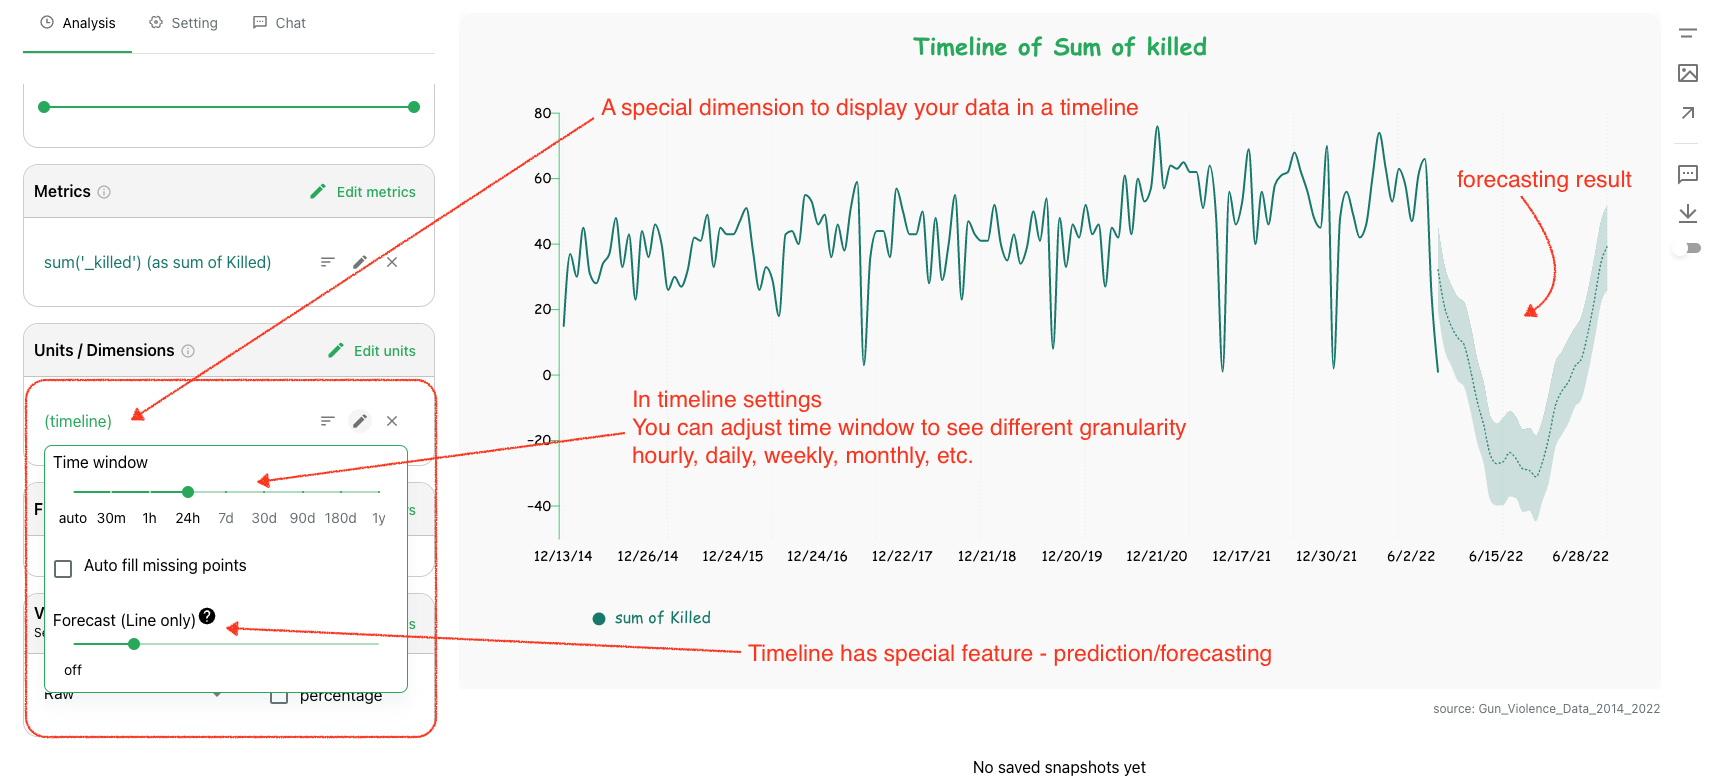
Forecast
Forecast is a feature that is only available for timeline. Since you're viewing one or more metrics along a timeline. You can easily turn on forecasting using the slider which holds a value of a percentage of existing value points. As illustrated above, it will predict all future value points for each metric, and display them in a bounded range.
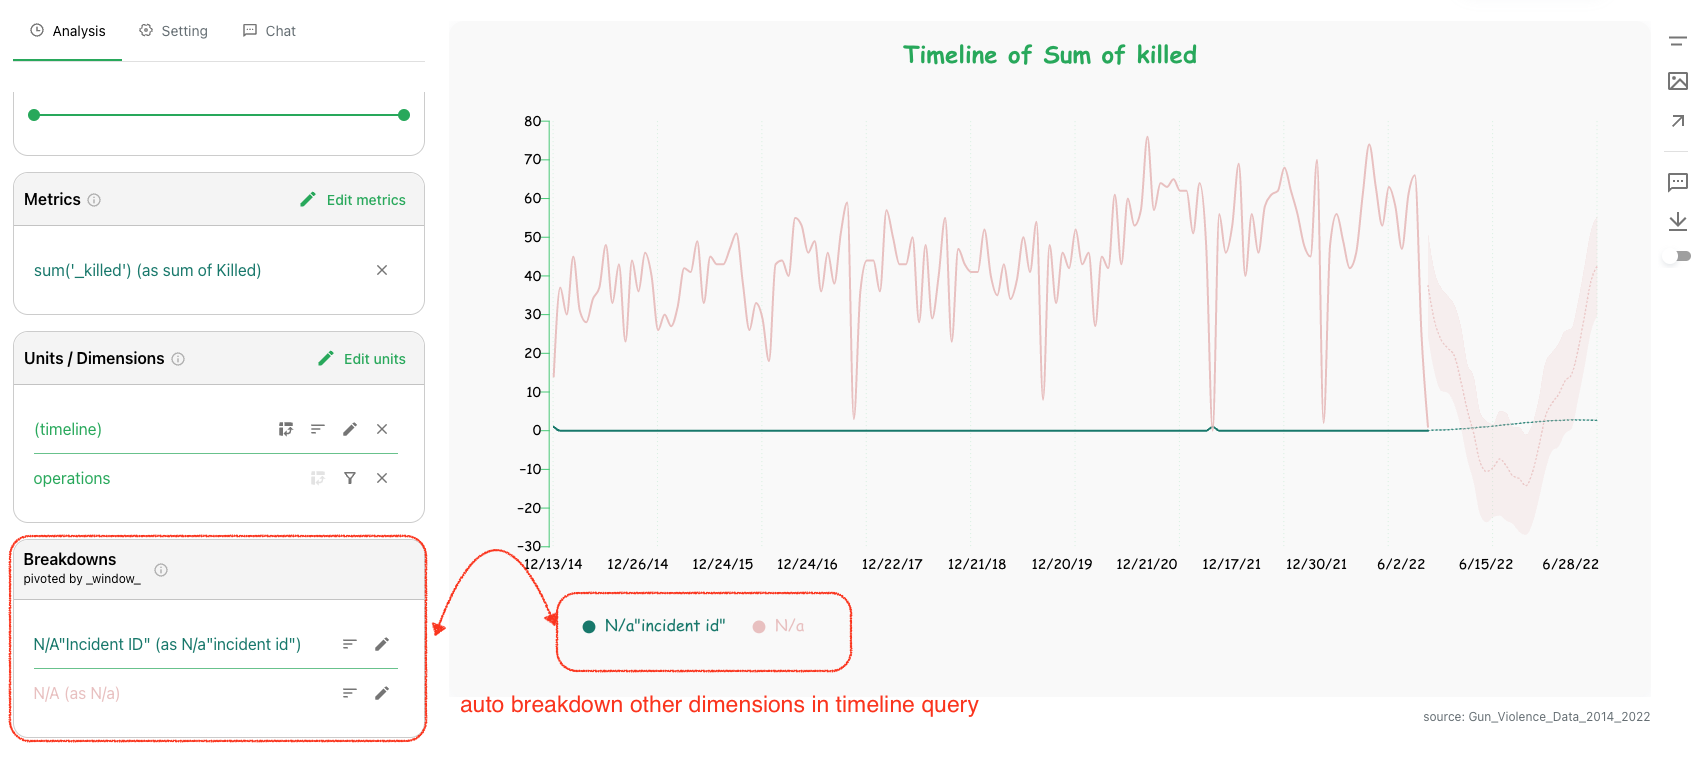
Auto breakdown
On Columns, we can specify pivoting when having multiple dimensions specified. If one dimension is pivoted, the other(s) will become breakdown on their values, so usually breakdown column is categorical value, otherwise, the breadown might be huge and difficult to read.
However, when working with multiple dimensions in timeline, the (timeline) dimension will always be pivoted, put the others as breakdown automatically.
As illustrated in this example: