Tree
Tree visualization is a way to visualize hierarchy data in a tree shape. Given Columns has its design canvas at 16:9 aspect ratio, we will prefer render tree in radial/circle shape.
We understand there are many different ways to render hierarchy data, so we may add more rendering types in future, please let us know if you need more support, it helps us to prioritize. Columns uses D3 tree visualization library to render a tree graph.
Requirement
To display a tree visualization, we expect the query result will contain at least two fields: id field and parent field.
idfield: identifier for current row.parentfield: identifier of parent row where we can connect current row to.
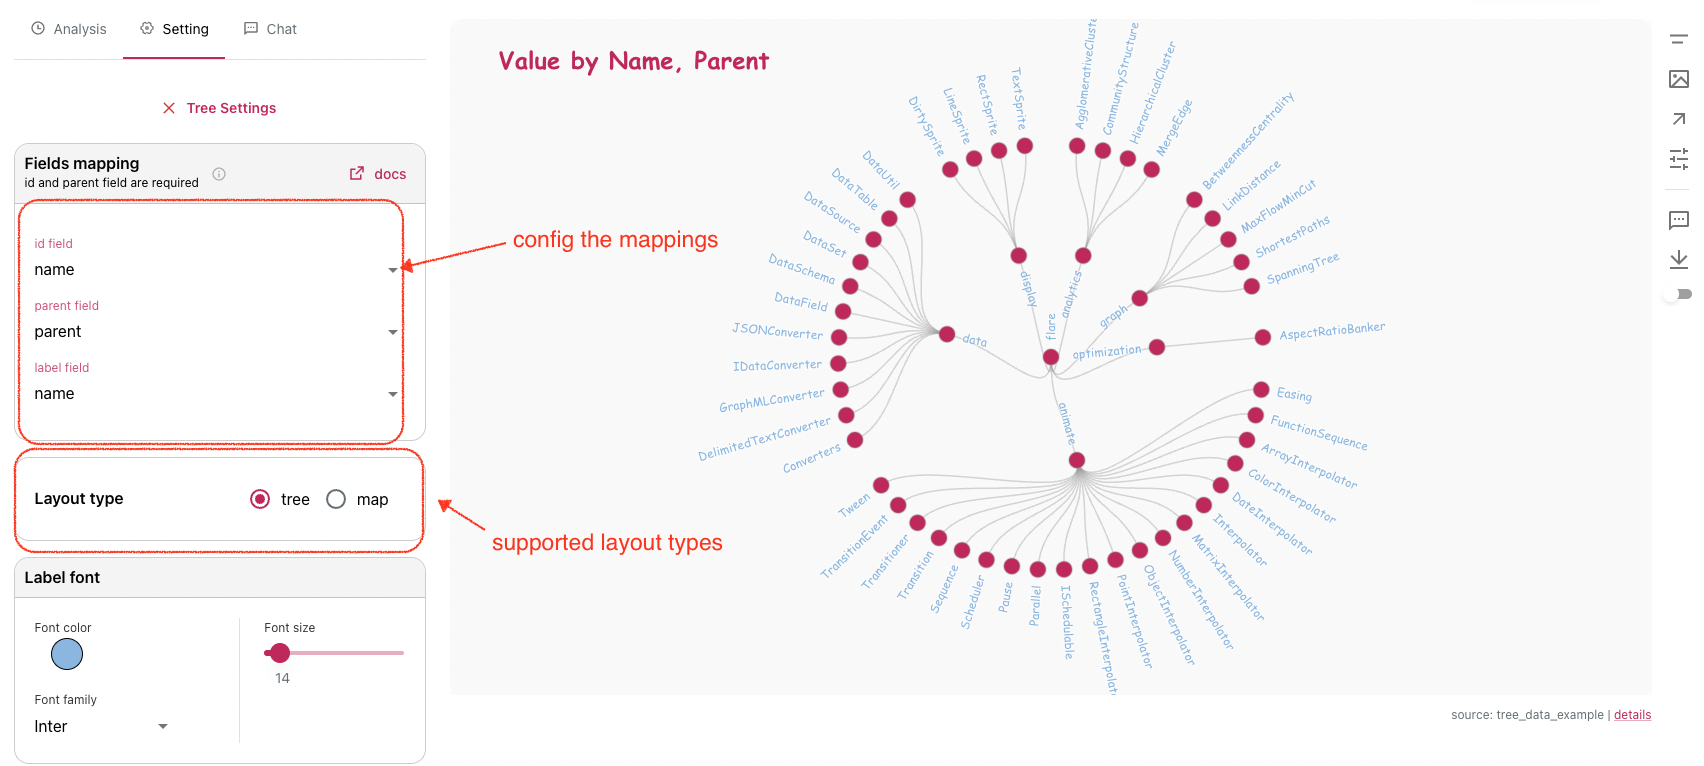
In tree settings, you could specify at least 3 fields to set up the tree visual, besides id field and parent field, label field is used to extract value to display.
Example
You can quickly generate Tree or Tree Map with this example dataset, click Explore and Visualize button.
Columns will load this shared data and generate a suggested template like this:
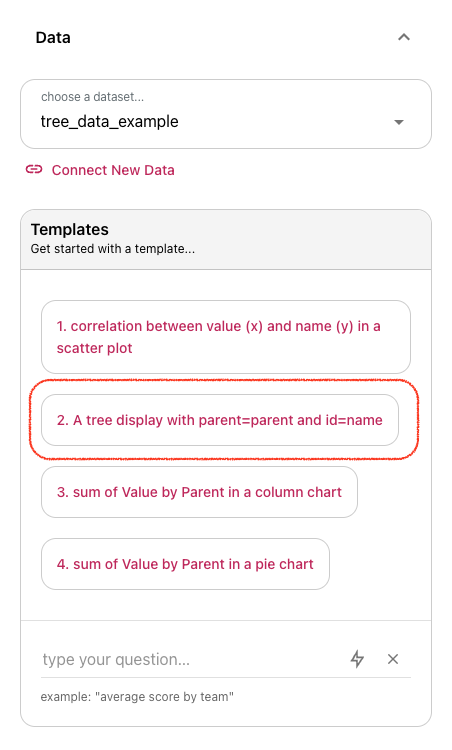
Go ahead to click this template, by default, tree will be displayed as in a ring of tree structure, but you can change it to use tree map instead in its settings.
Tree Visual Anatomy
Let's take a look at an example to explain how it works
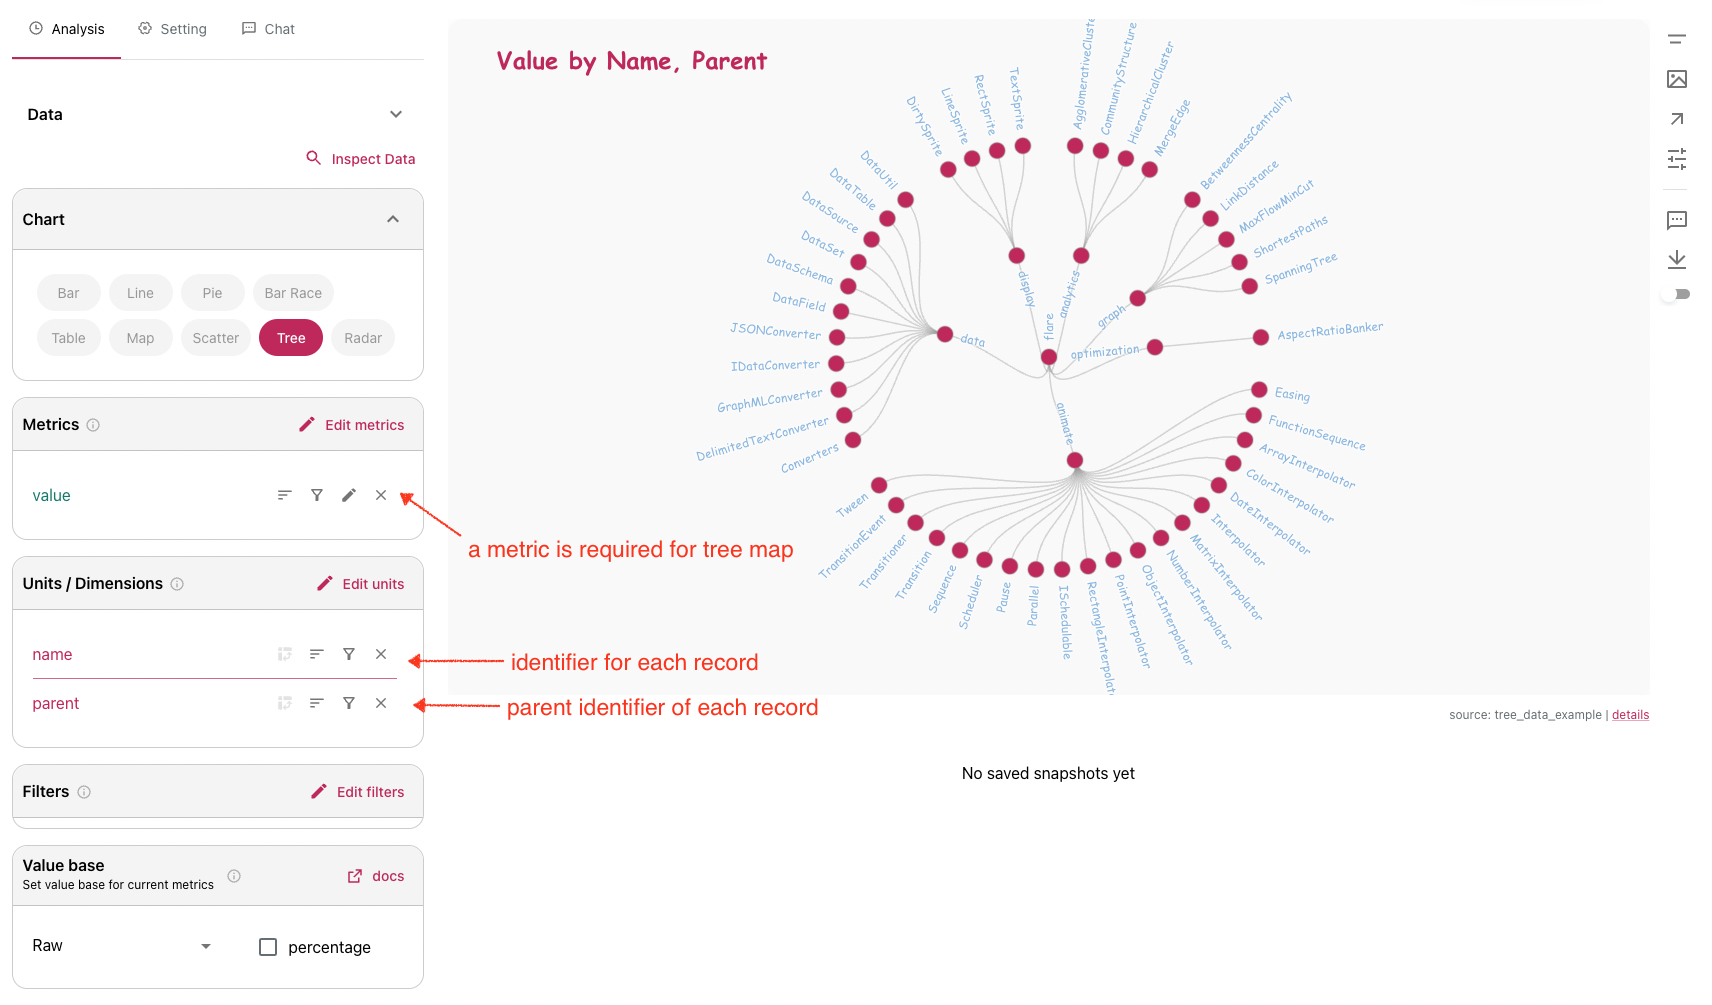
This query selects 3 fields from the example data set, and choose Tree visual type.
By clicking any node, you will have Tree Settings panel showing up on the right side, where you can tune node color and size, label font properties as well as layout algorithms.
Color scale (Tree Map)
In tree map mode, every tile can be associated with a color based on its metric value. The color scale uses quantize method to assign color to a value in its range. But if color scale only has two values, it will use linear method to generate unlimited transitioning colors in between.