Visualization
Columns visualization is its core experience that we're proud to serve our users with. We're constantly improving visualization experience to make you happy!
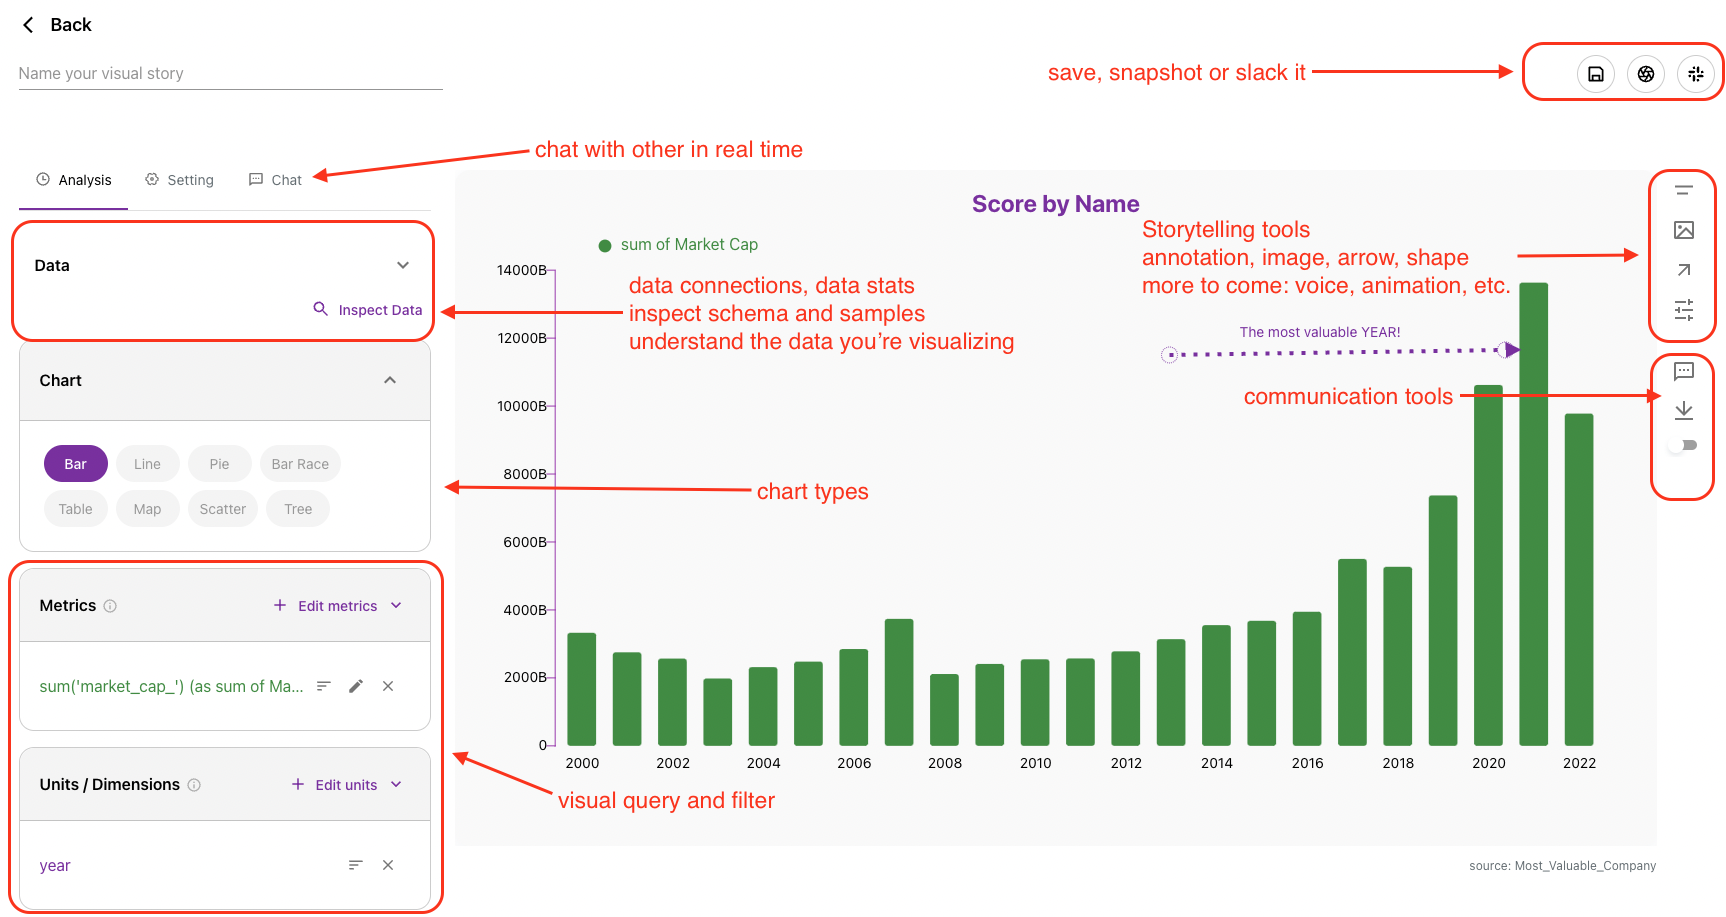
Visualizer anatomy
Columns visualizer is the place we analyze a dataset and visualize it easily. A visualizer has 4 different types of components in it:
- Visual query (right): here you define how you want to analyze the data in a visual interface - define dimensions, metrics as well as setting their properties.
- Visual canvas (left): visual canvas is to visualize your query result but also interactive for customize and styling each item in the graph.
- Storytelling tool: this is mixed with graph settings together with chart related functions, such as highights, contrast, etc.
- Communication tool: we can use these tools to download visual in different file formats, share snapshot in Slack, copy snapshot link and create data story/app from.
[visualizer anatomy]
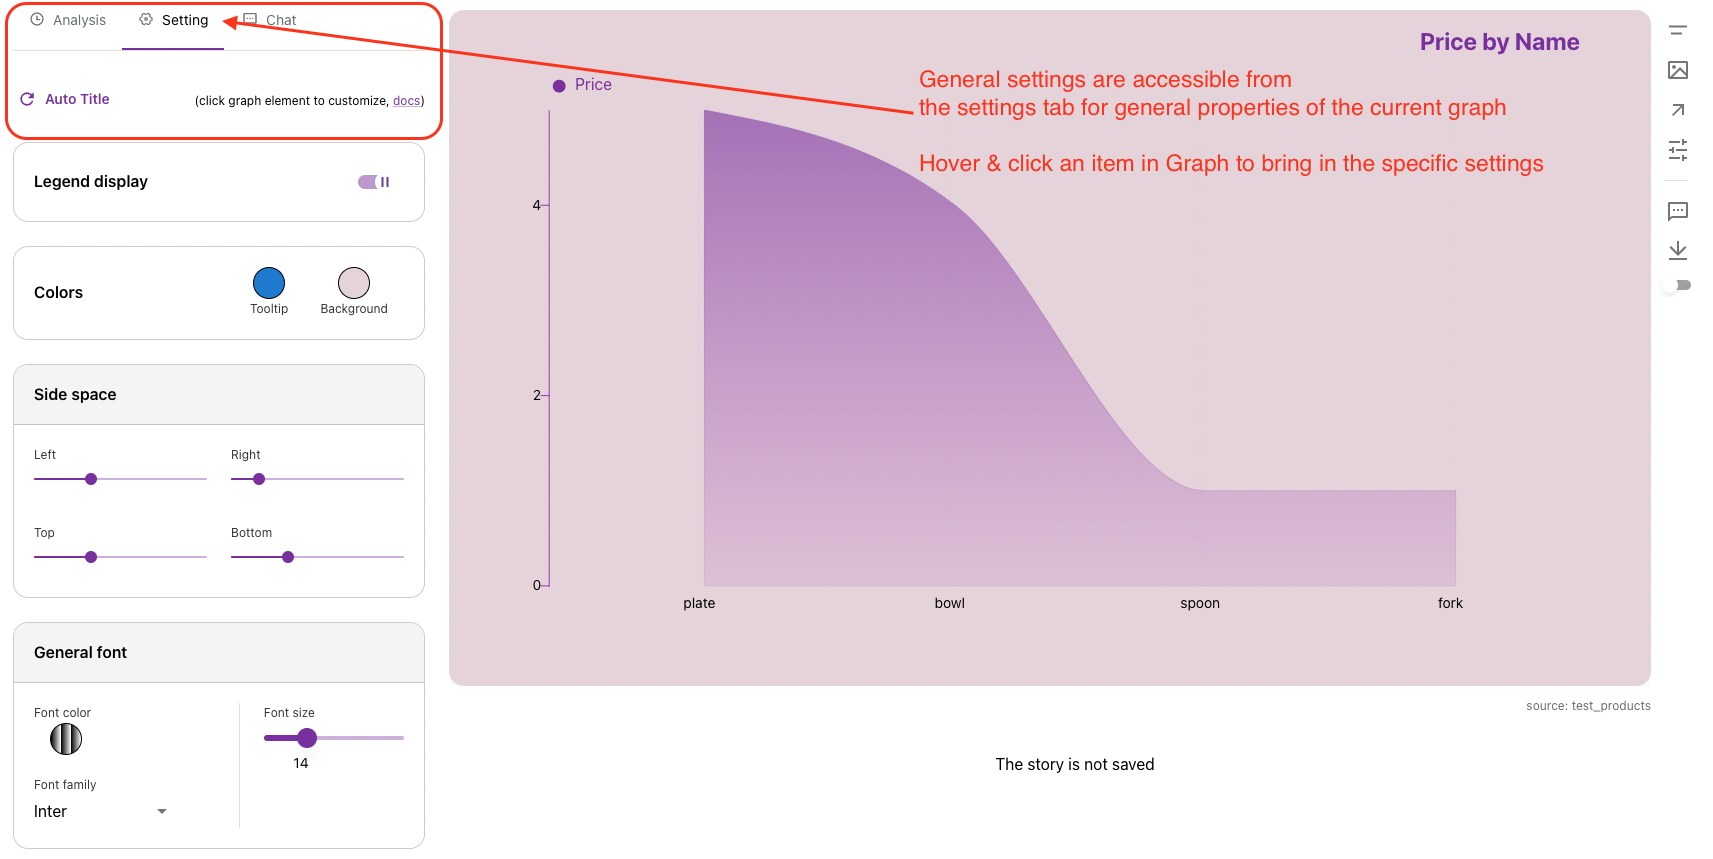
Settings panel
Almost any item on the canvas is clickable and customizable. For example, we can highlight a specific bar (or group) in a bar chart
for example:
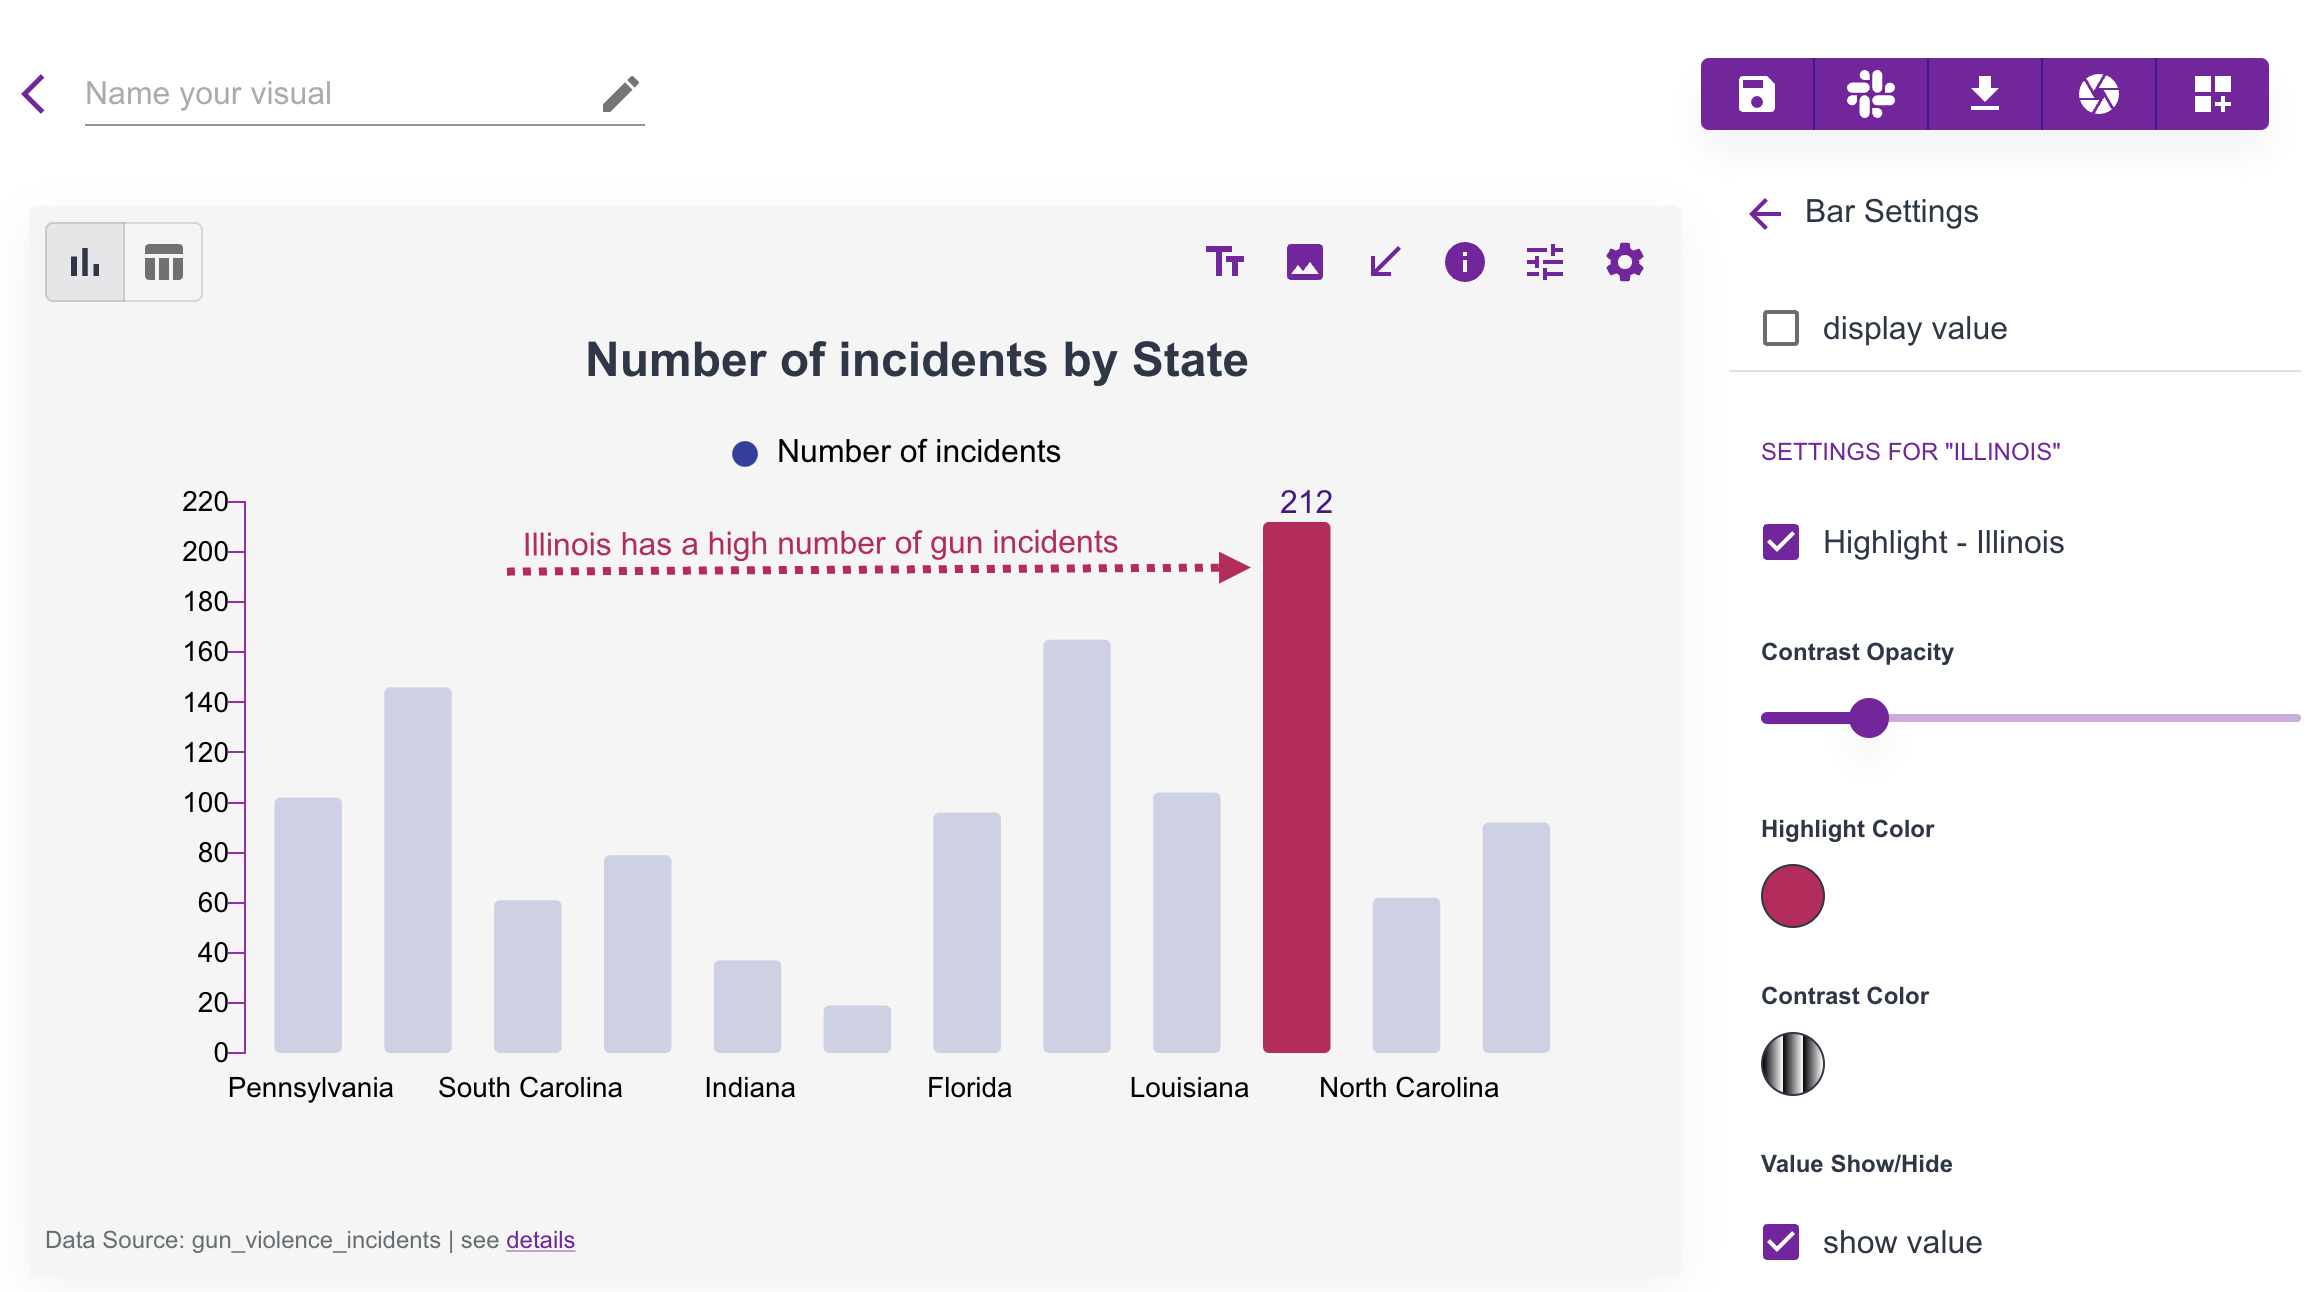
To customize the whole graph, you will need to click this single settings icon
Visual gallery
Besides instant communication in visualizer, each visual could be saved in your own gallery. Visuals in gallery can be used for sharing, embeding, or a story.
Share a visual
Sharing a visual is to generate a public link (or pass code protected) to be accessed on internet.
This can be toggled on or off through the share item in each visual's action list.
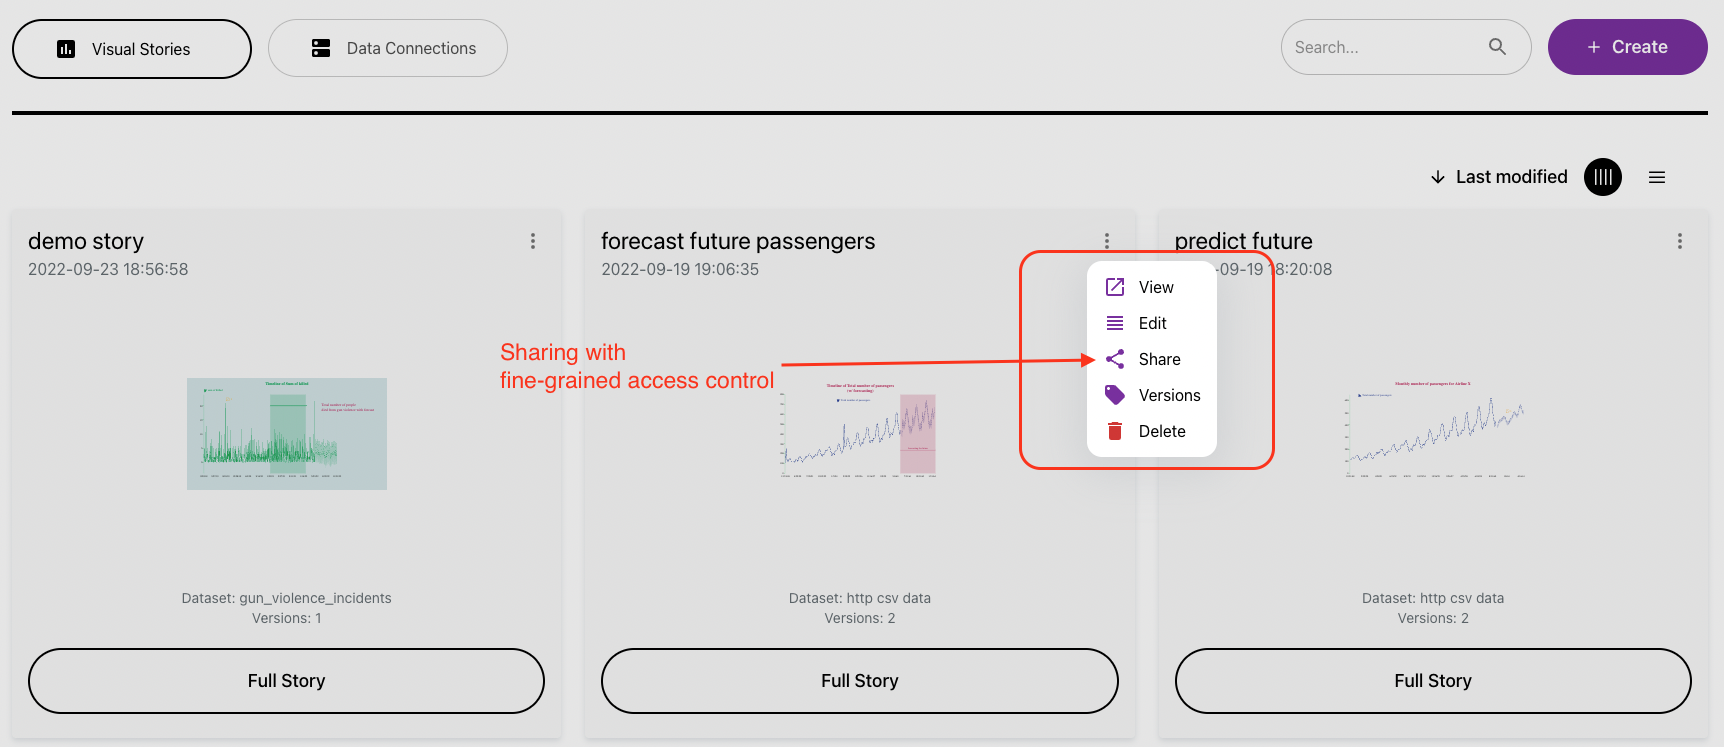
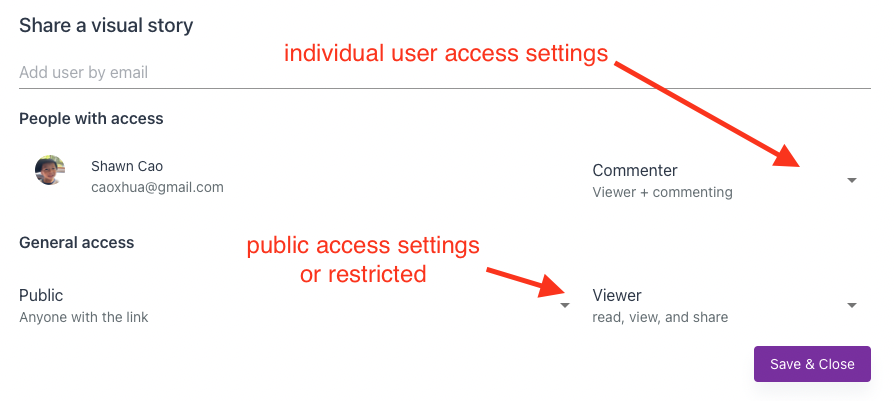
There are 3 sharing levels:
- restricted: resource shared in this mode will only be accessed by people you added in the sharing dialog.
- team: this only applies to team on Columns, only team members can access shared resources.
- public: everyone with the visual story link can access this resource.
Access scope defines permissions that audience can have: view, comment, edit.
Embed a visual
After sharing a visual, you will get a unique link to the visual story.
You can share the link to any social media or communication channel, also you can easily copy the embed code to display the visual on your own website.
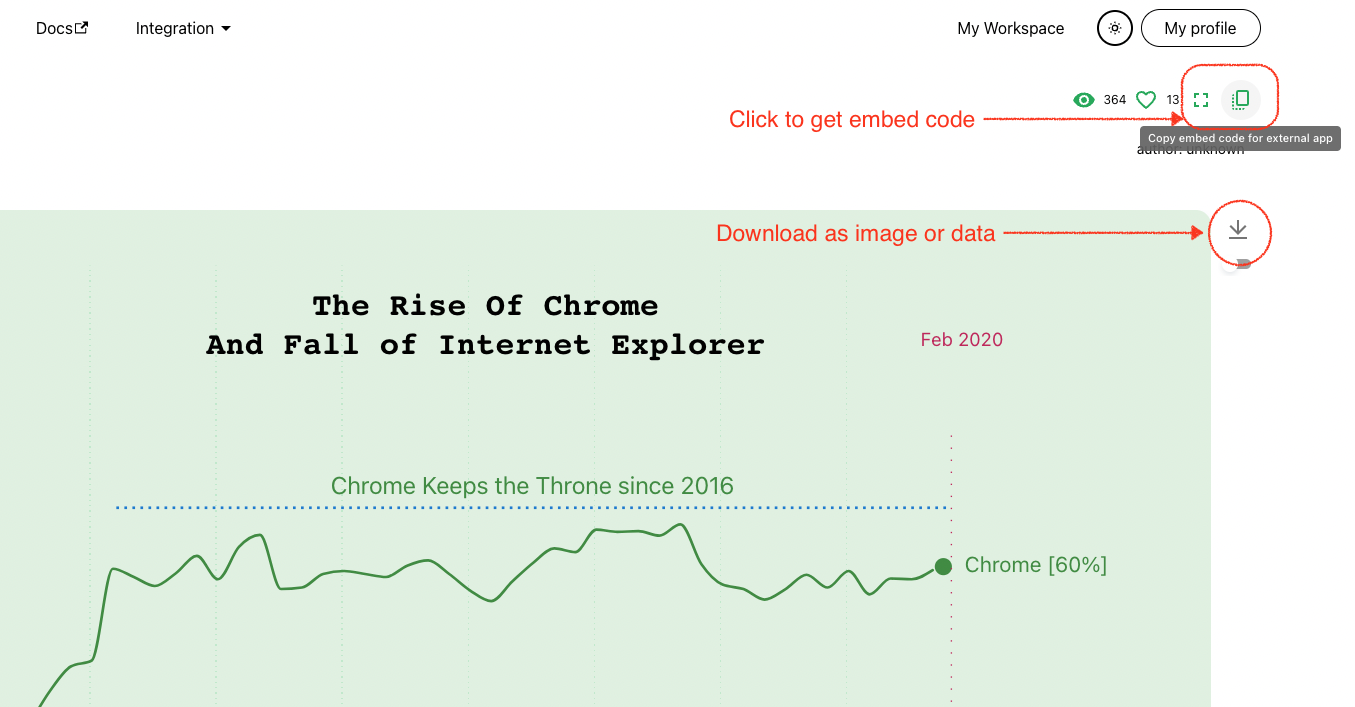
Usually, to embed a visual, you need to share the visual at public level so anybody on the internet can see it.
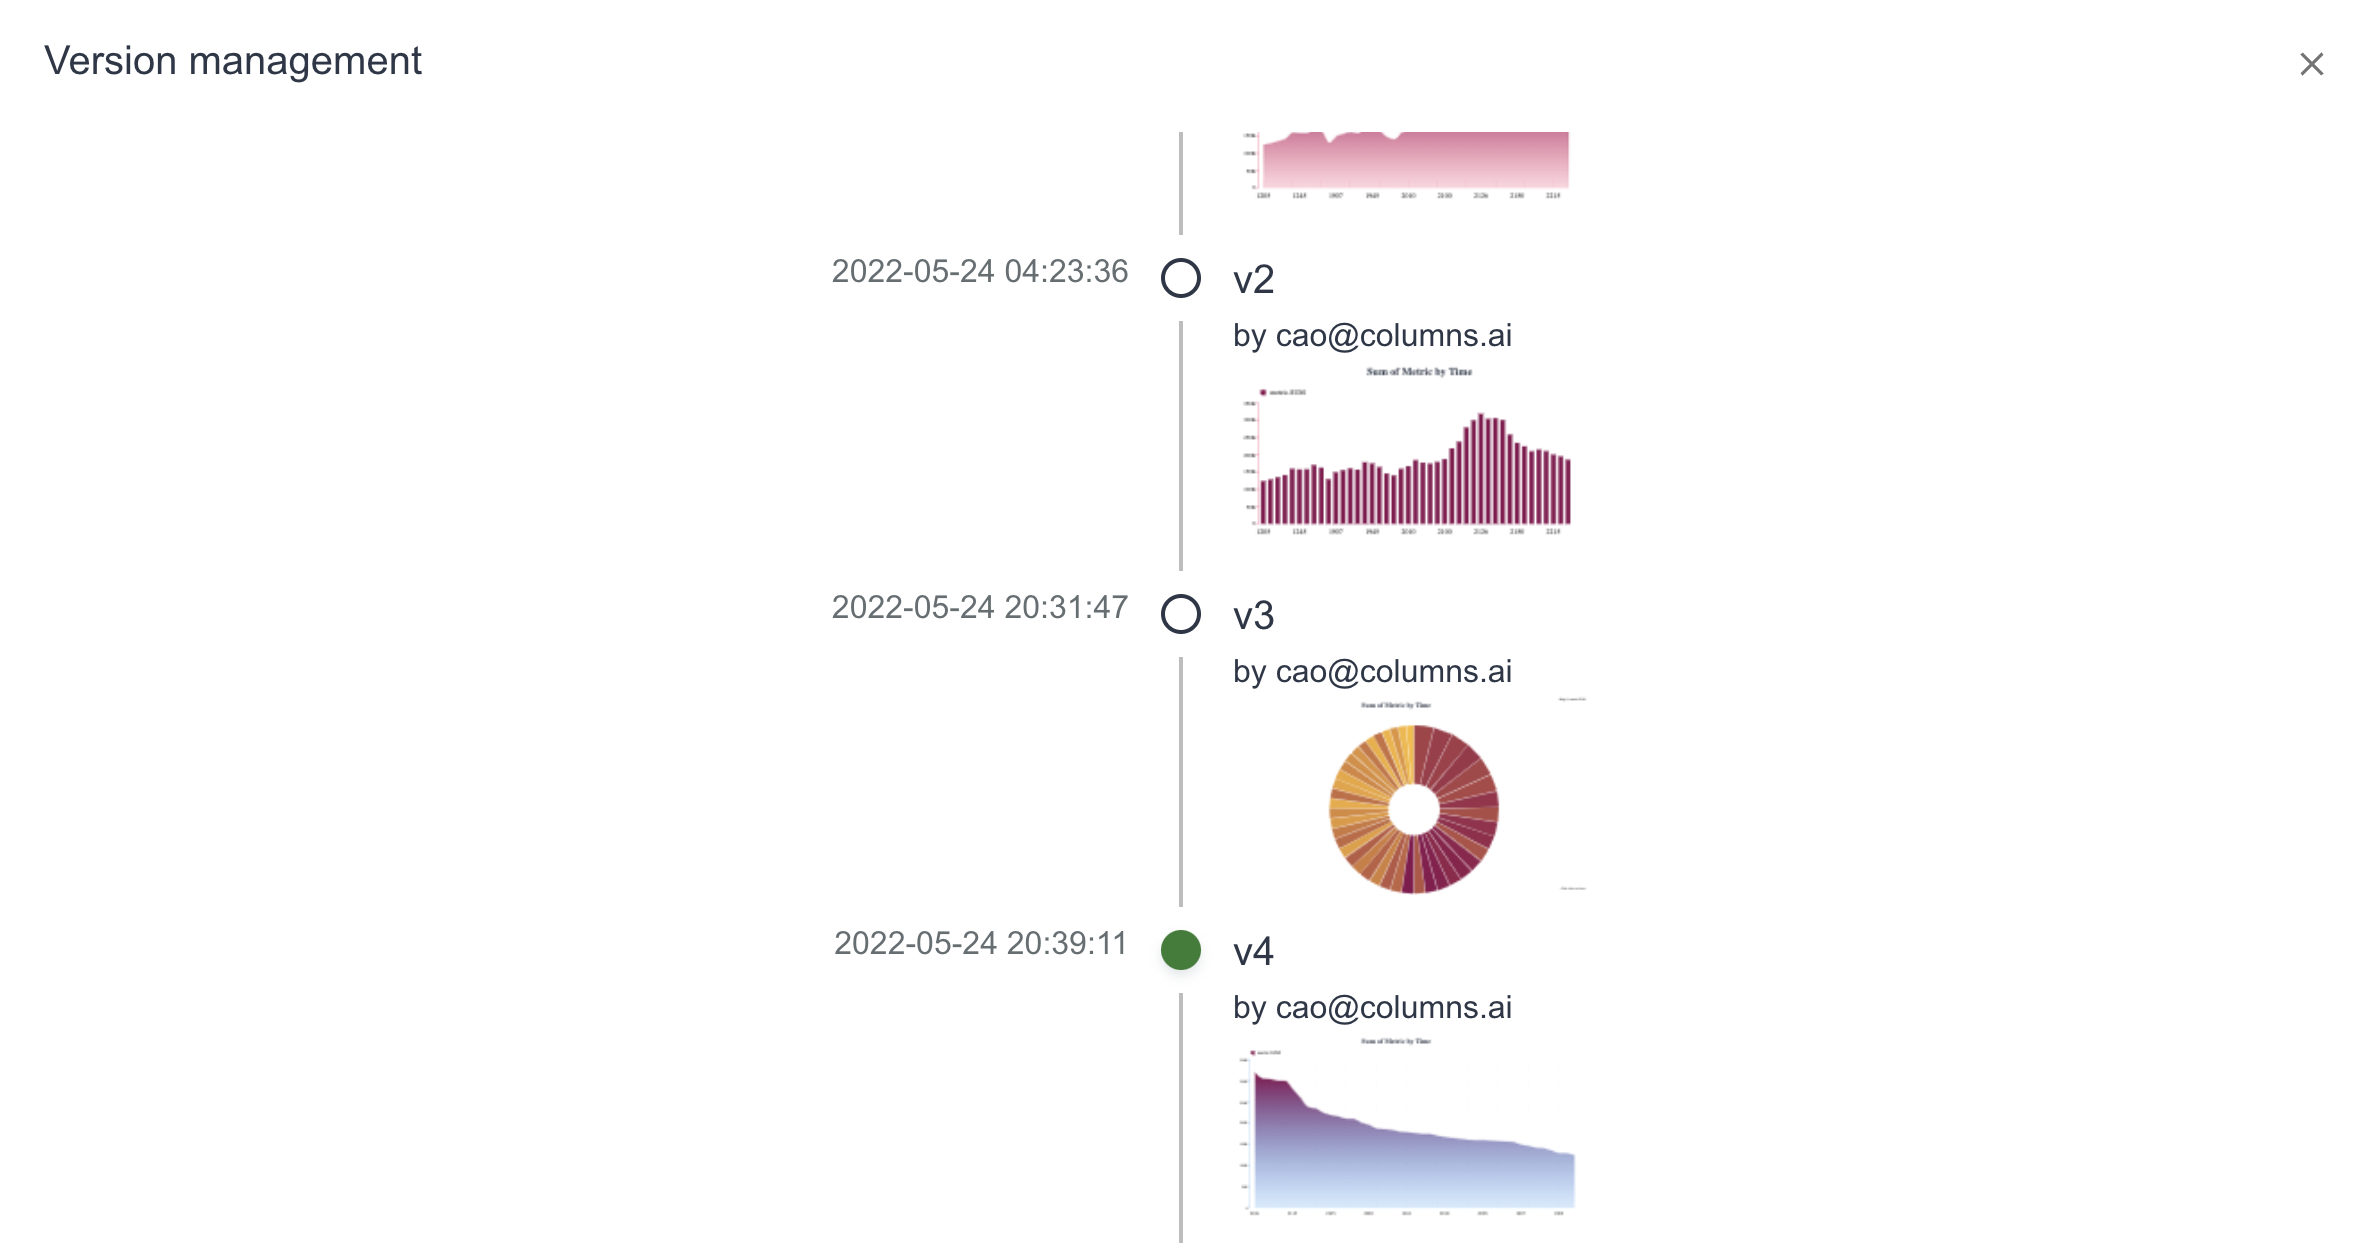
Version control
Every single visual can be edited and multiple versions could be saved in it. This is useful to team of multiple people who can work in a single workspace (company workspace), they can then collaboratively develop insights with version control. Through version control UI, users can choose and set default version for a given visual.
for example: