Radar
Radar is a good way to put one or more metrics in a radial surface with multiple layers to understand value distribution.
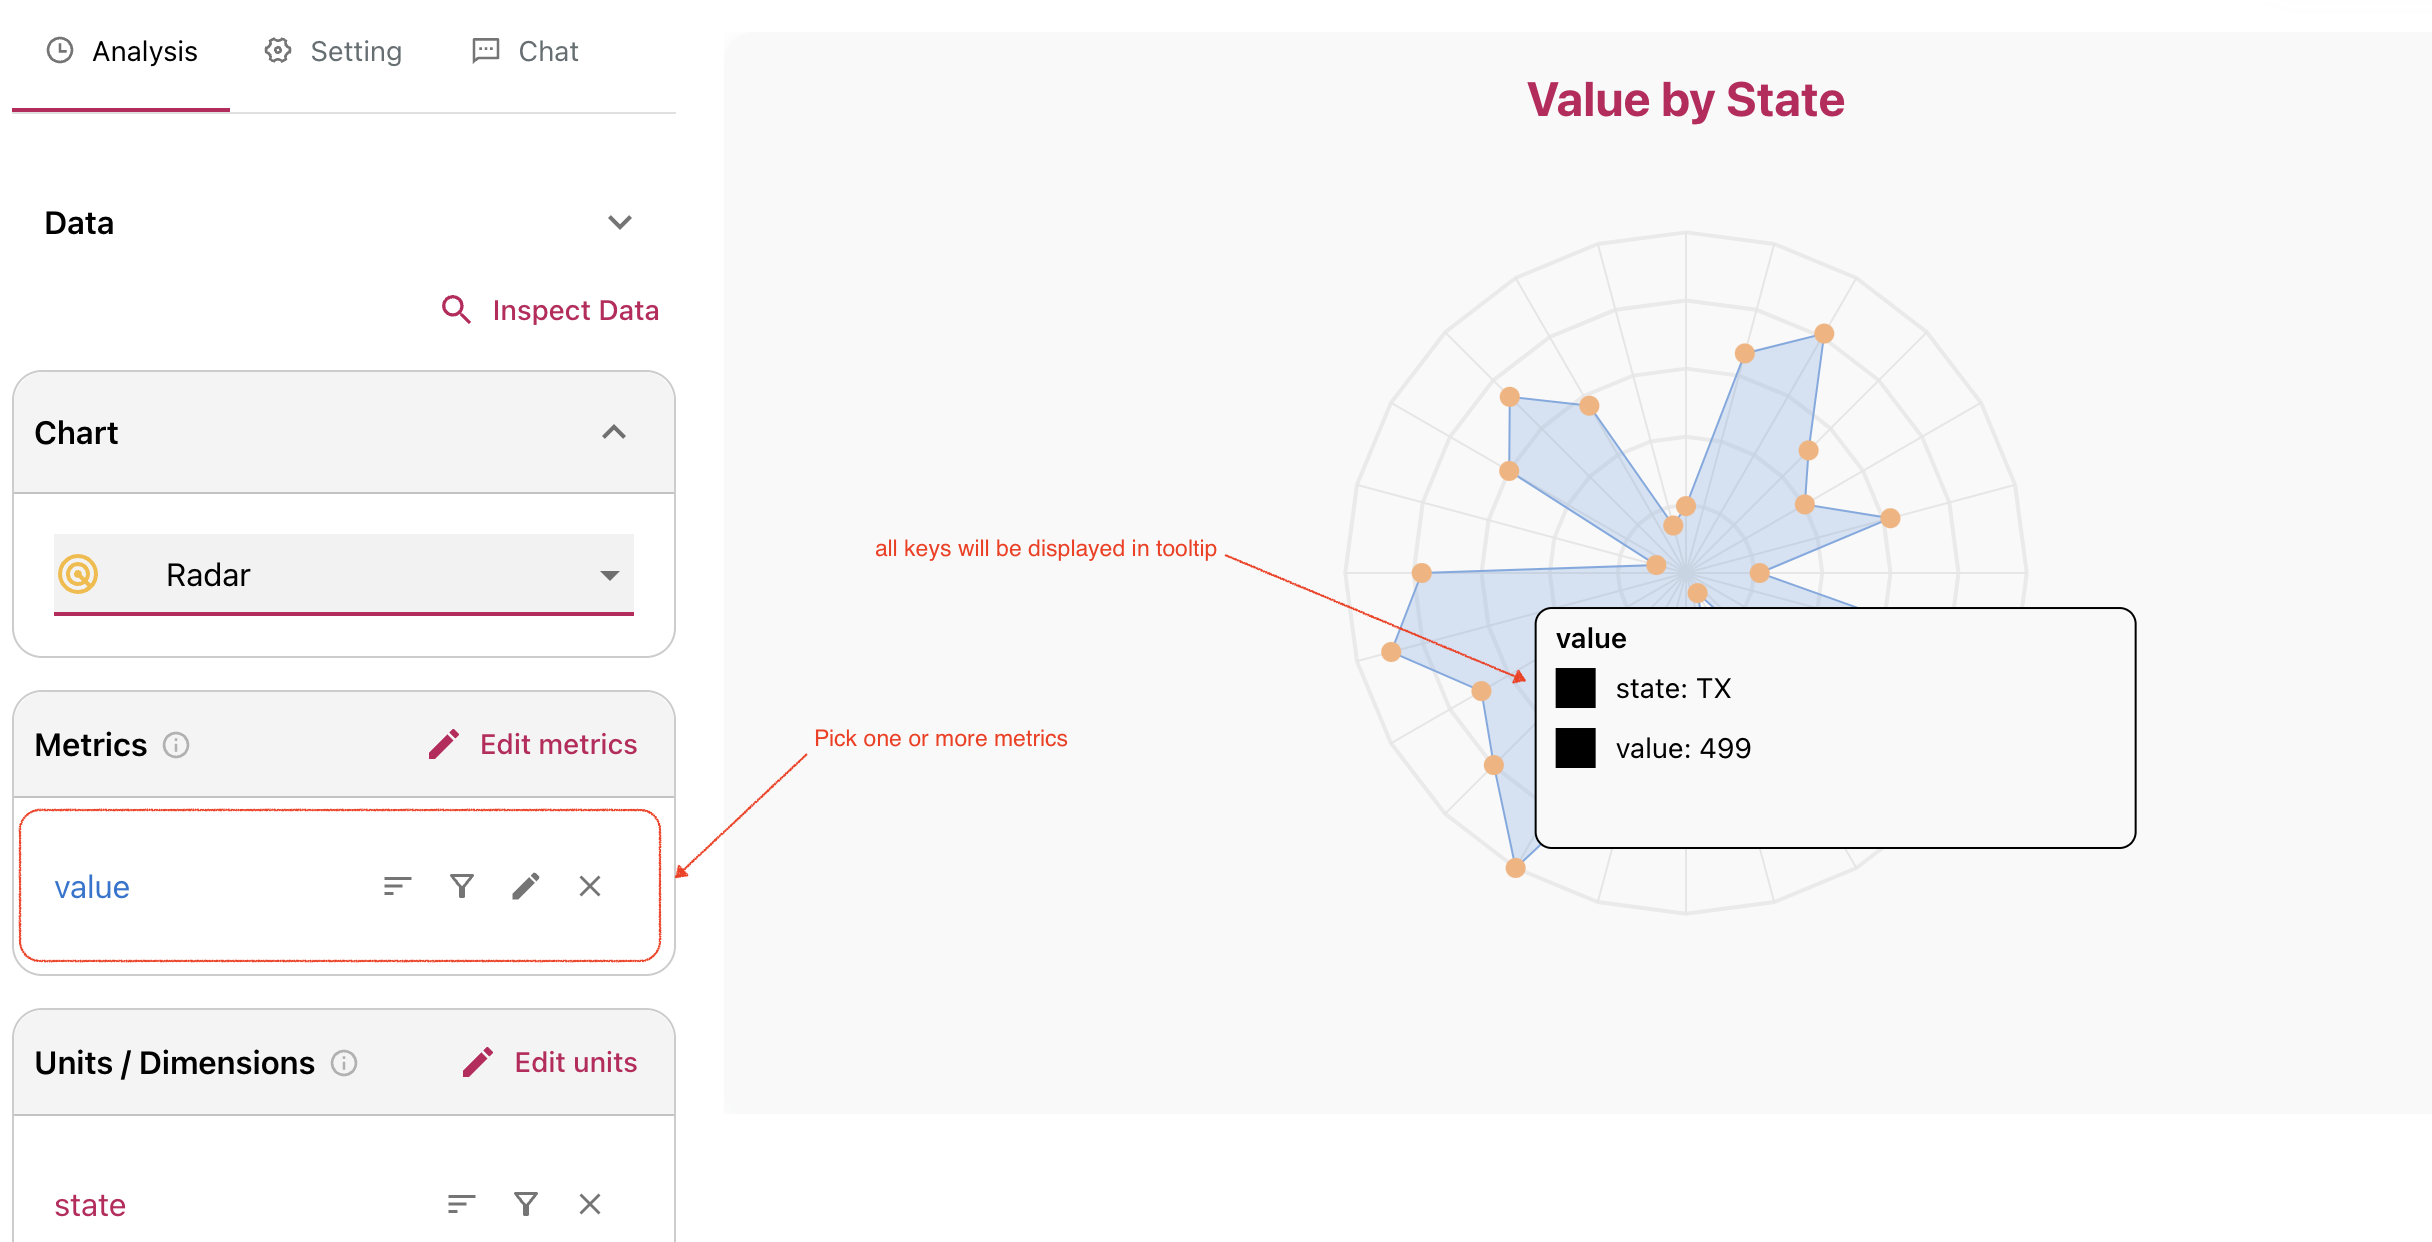
Illustration
It's very straightforward to build a radar graph. Just pick one or more metrics. All dimensions/units will be shown on tooltip when mouse over a (data) point.
Settings
Like other type, click in graph area will bring up setting box. You can also find settings in "Settings" tab.
Grid color, point color and size are customizable.