Dashboard
Dashboard is a collection of many metrics you would like to see in one place.
On Columns, we call it Page, a page is a list of visuals that could be arranged in a grid for display.
Please note that, some advanced dashboard supports user inputs and dynamic features, Columns Page doesn't support that.
Create Page
Creating a page is very simple, just start with adding a visual to a page.
Like this:
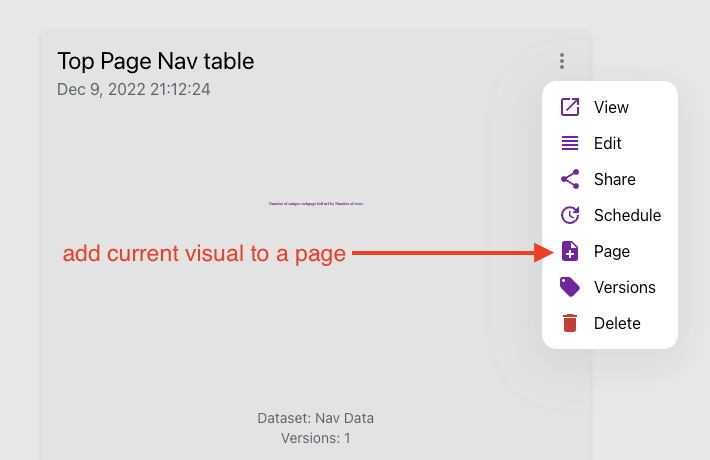
In the dialog, just select an existing page or type a new name to create a new page.
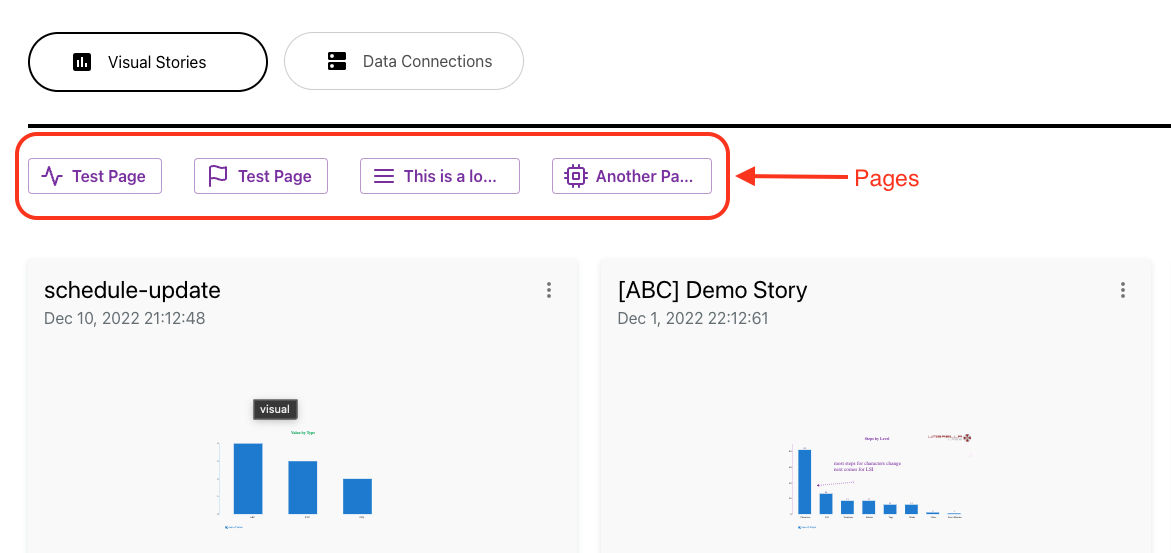
Your pages will show up at the head position of your visual gallery.
Access
Pages can only be visible to people in current workspace, it can not be shared externally.
Schedule + Page = Live Dashboard
If you haven't checked out schedule yet, read the previous section on schedule.
Schedule allows you customize the frequency of auto-update for your target visual graph.
Once schdule set, Columns backend will automatically update your visuals.
Now if you put all auto-updated graphs into a page, this page will be your Live Dashboard.