Pie
Line chart covers both line and area, it's mostly used for timeline or illustrating trends.
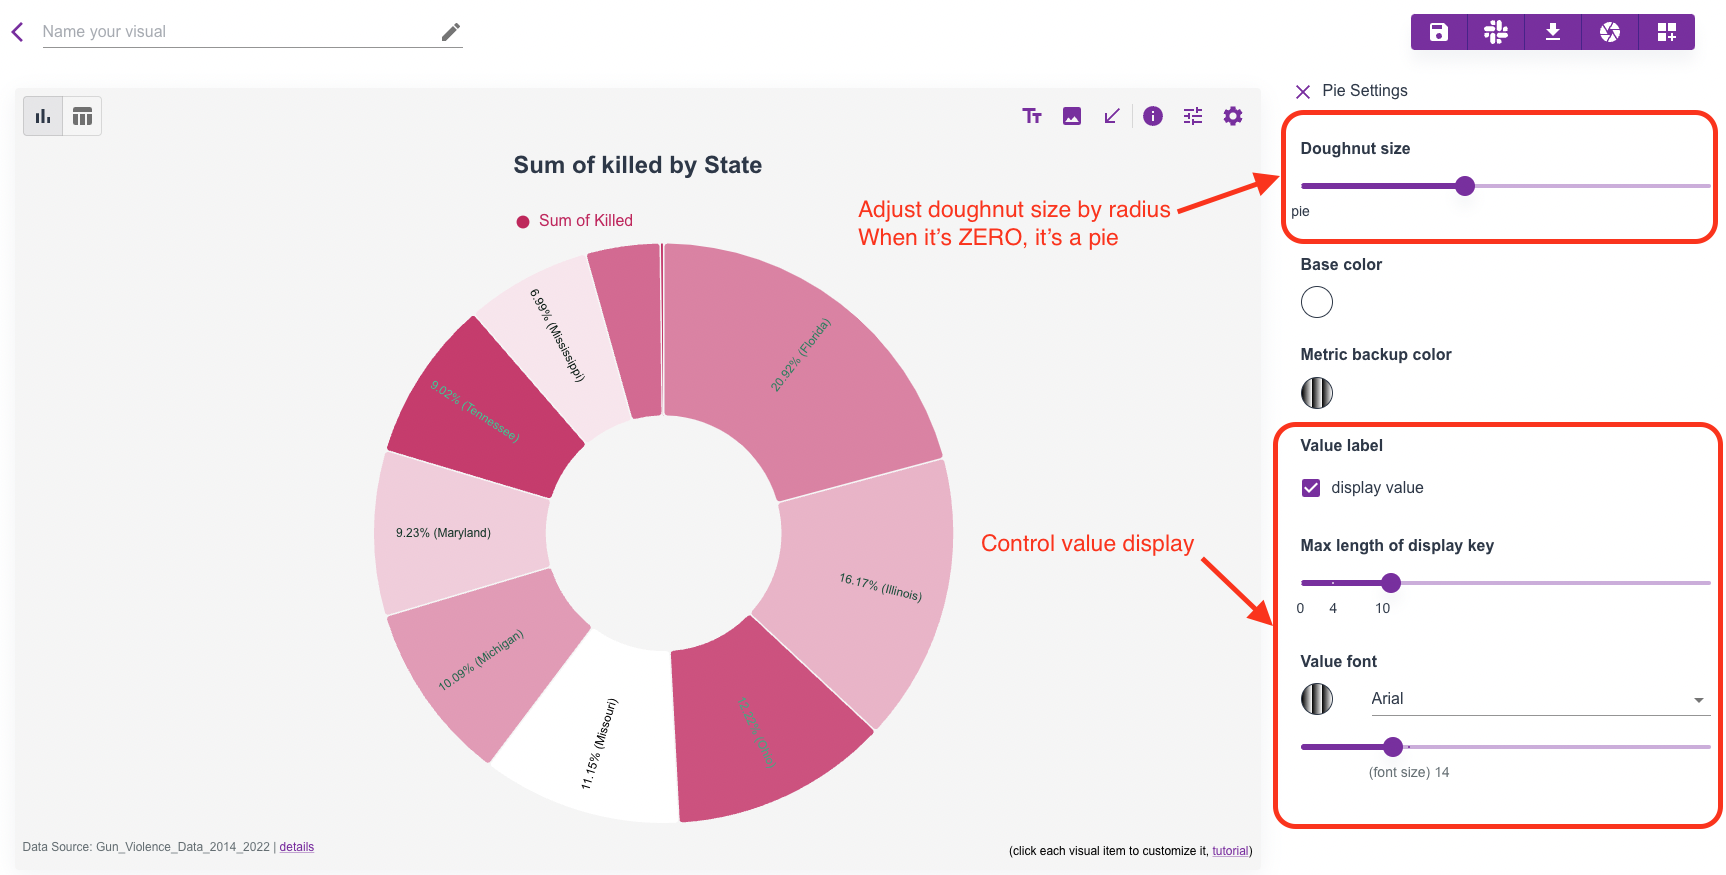
Pie vs Doughnut
Pie and doughnut share the same graph with adjustable doughnut size.
Value display
Pie has value displayed in each slice, we can control whether you want to put associated key in it or not.