Bar
Bar chart is used very often, we can use it in many different ways. Here, let's take a look its speicalities on Columns.
Vertical vs Horizontal
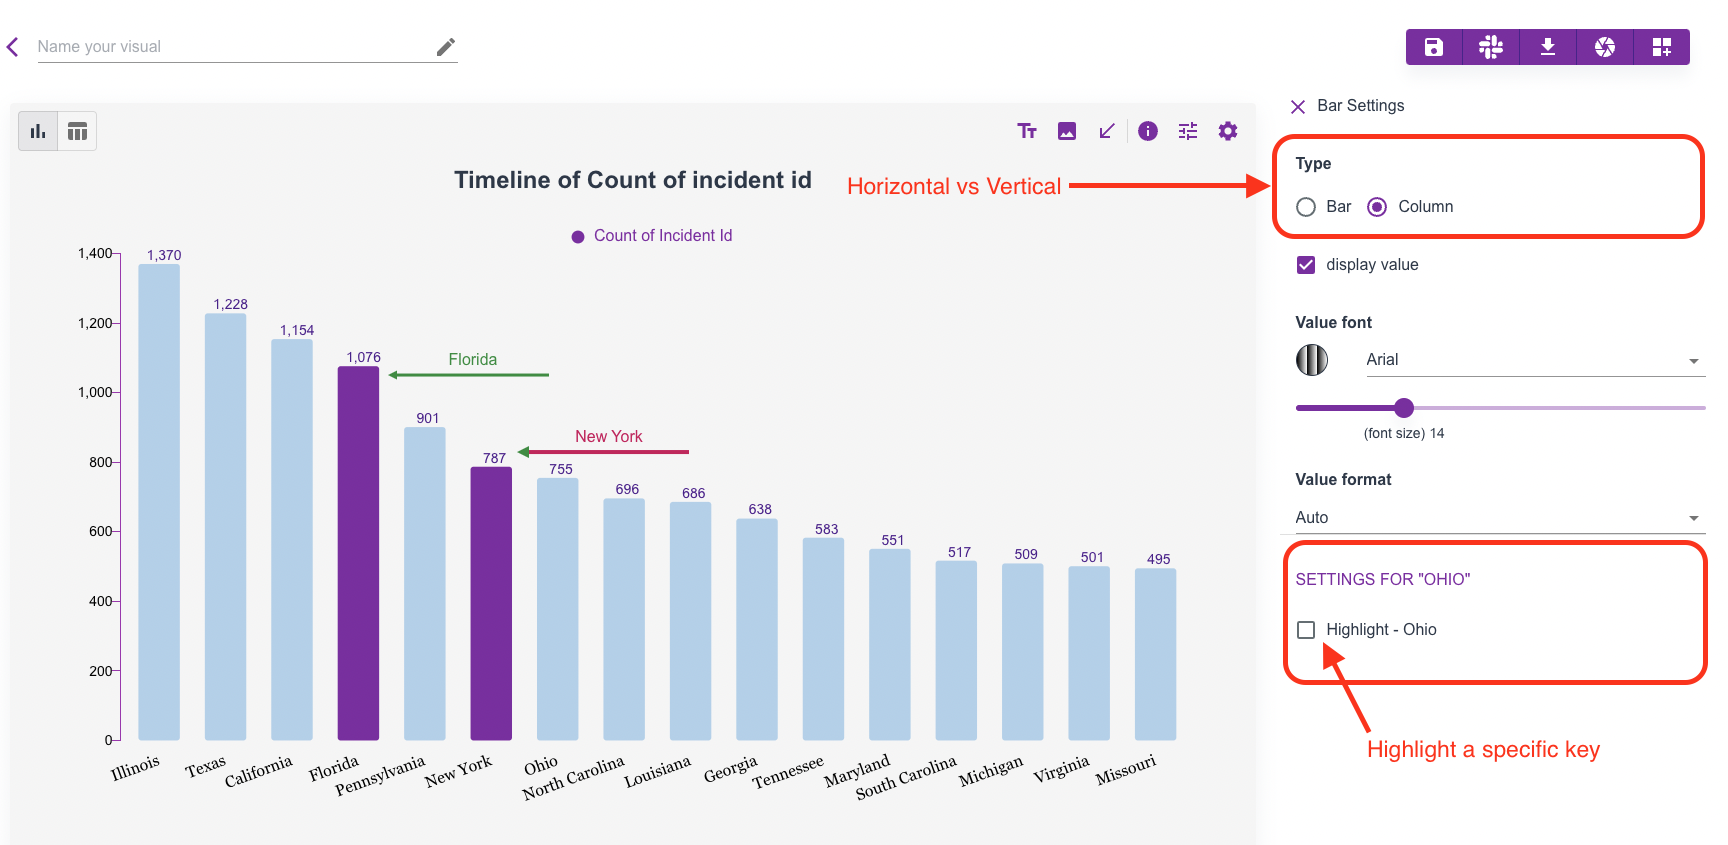
Usually we call vertical bar as Column chart. This can be set by clicking any bar in the graph.
Highlight bars
When clicking a specific bar, we have chance to highlight some of them while put others in background for focus. This is one example that we highlighted two bars

Stack vs Group
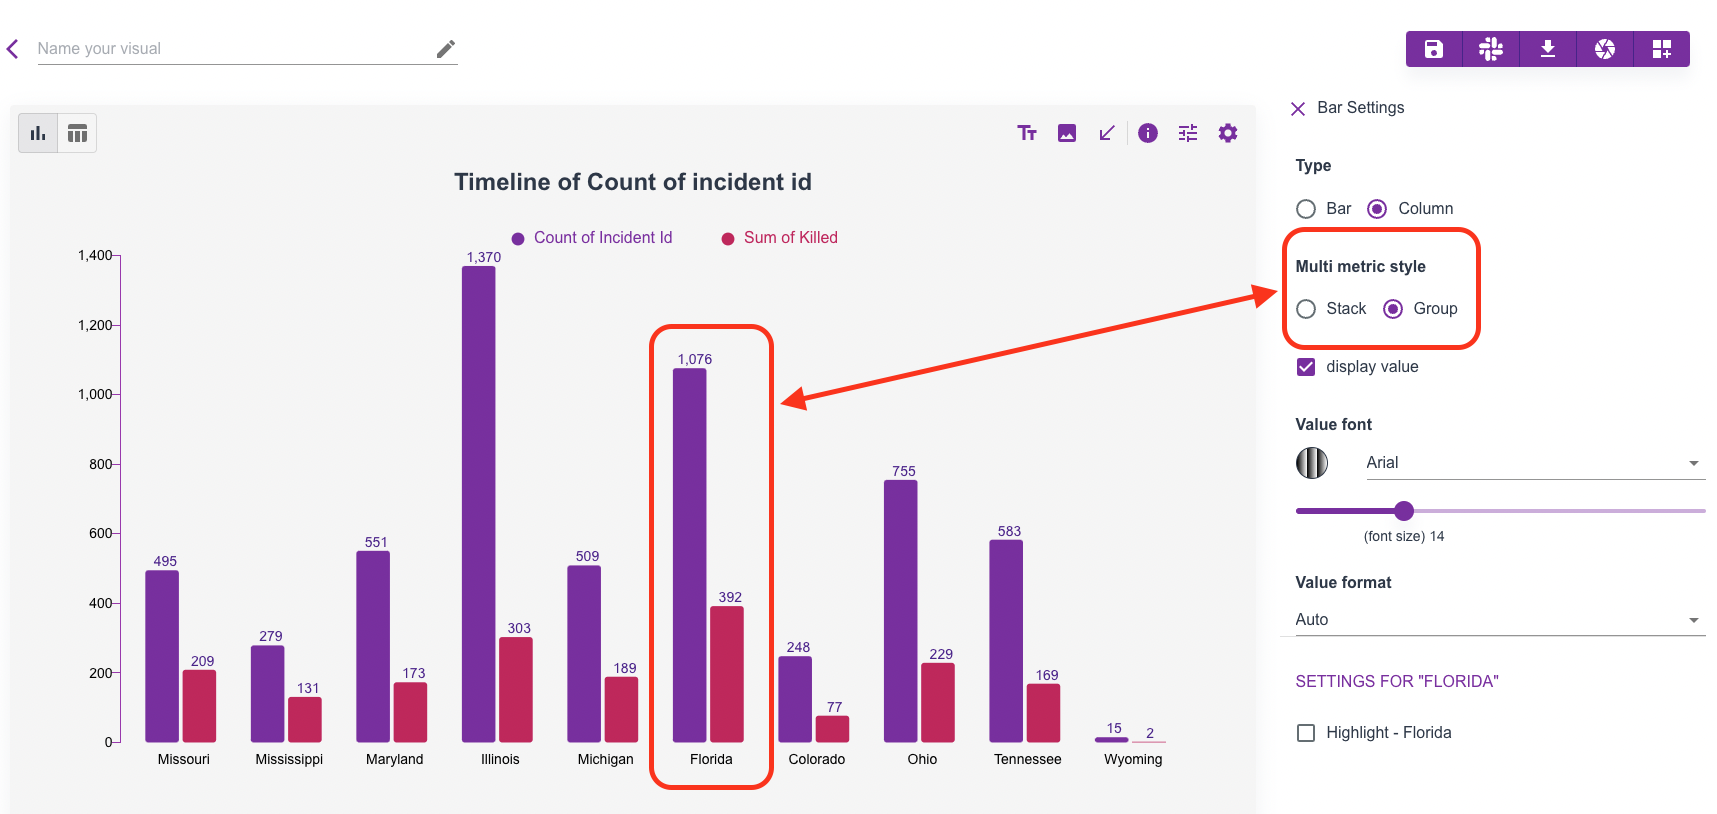
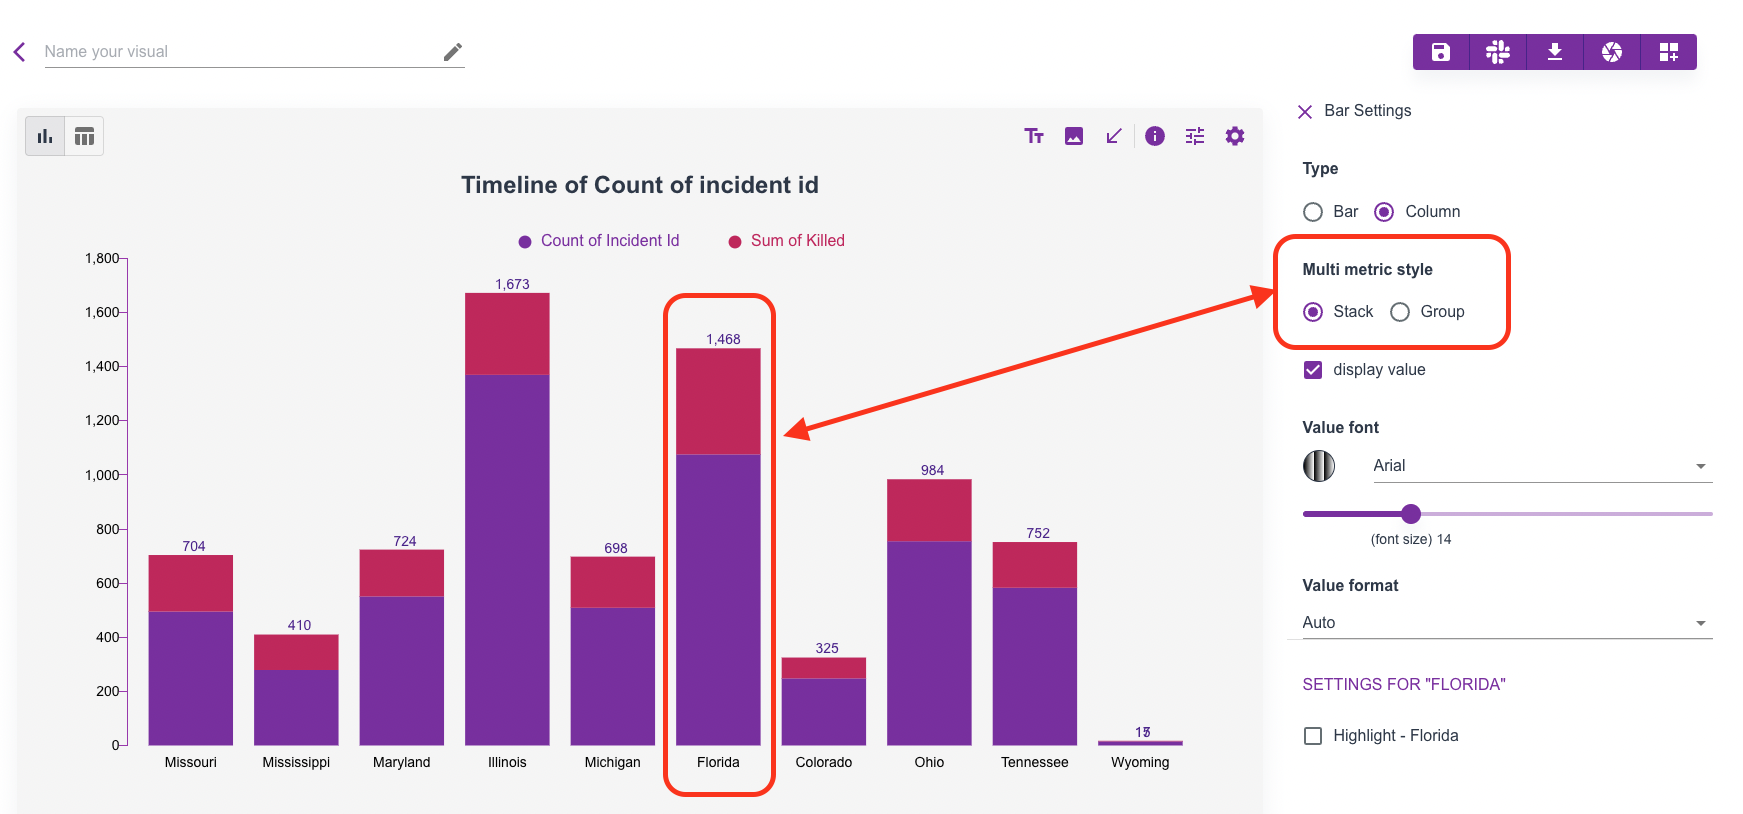
When working with multiple metrics, we have two choices to display metrics side by side. Group put metrics as multiple bars in a group key. Stack put metrics as multiple sections in a single bar.
 vs
vs
