Boxplot
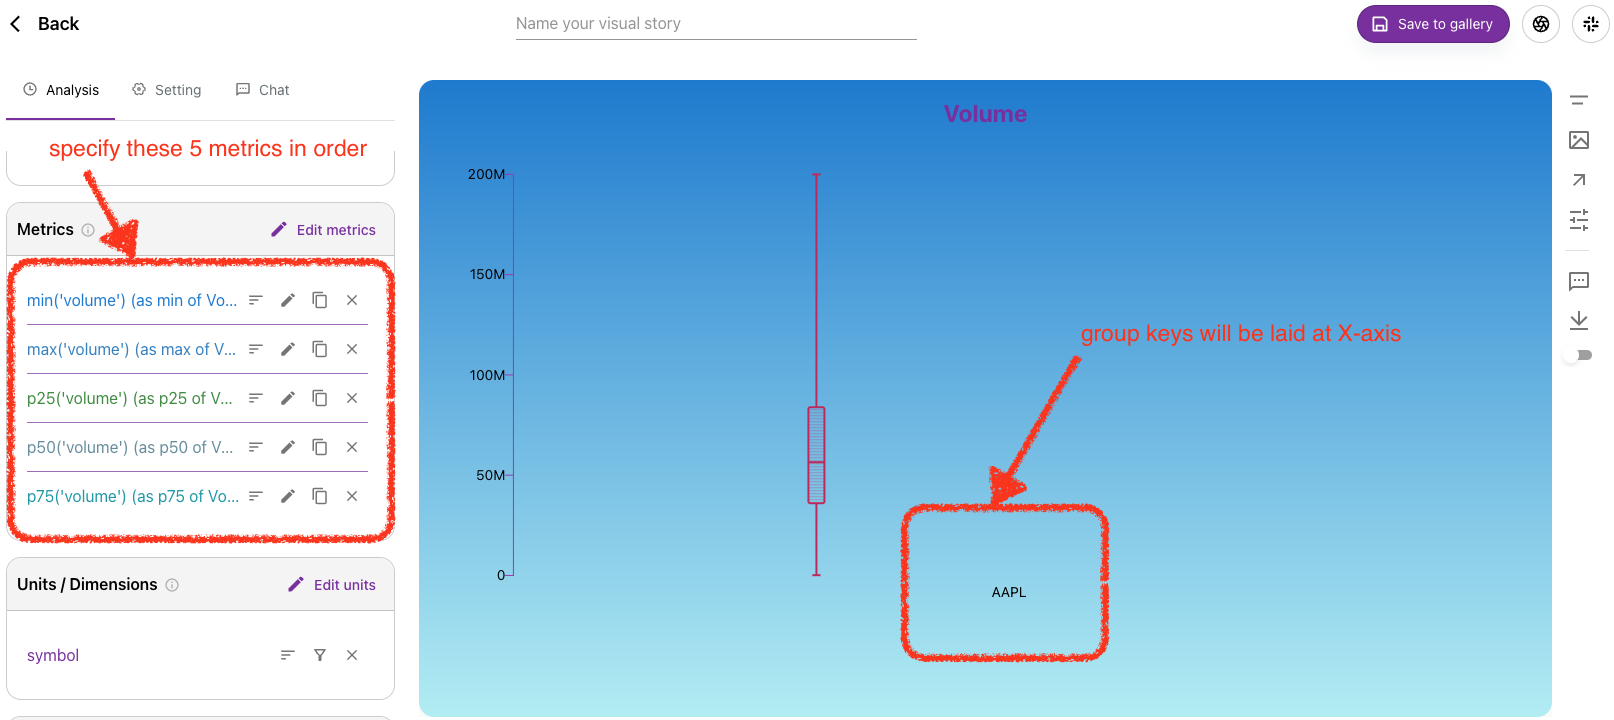
Boxplot is a common stats plot that it plots most useful metric at different quantiles for each key. To make a successful box plot, your query will include these 5 metrics in sequence.
- min
- max
- p25 (aka: quantile-1)
- p50 (aka: median)
- p75 (aka: quantile-3)
NOTE: we are adding a simple wizard that users only need to select the column name, and the system will generate all above metrics automatically. Before this, please do this manually in the "Metrics" box.
Illustration
You can have keys or no keys, but the 5 metrics are required. If there are multiple keys, then we will have multiple box plots.
Settings
We don't have much settings for now, only you can change the box plot color. Tooltip color can be found in general settings tab.