Live Dashboard Release
Greetings!
Columns is a data storytelling platform, we have continued building storytelling technology for you to do better communication using your data. It is designed to meet these goals, if any of these fails for you, we owe more work to you:
- Easy to discover and generate visual insights by data analysis.
- Handy design tools to customize and style a data story.
- Worry-free sharing with multiple communication methods.
In the last few months, we have received many user requests on building a dashboard. Columns is powered by its own big data computing infrastructure which serves large data set analysis, this distributed system is actually open-sourced, you can find it on GitHub if interested. With the advantage of this infrastructure, we can keep your visual stories in sync with your data.
So today, we introduce you Columns Live Dashboard.
Live Dashboard
First of all, we created a 40s video as an overview, please check it out on Youtube.
On Columns, a dashboard is simply called a page, a simple page that collects and organizes multiple visual graphs together.
The gold part is “LIVE”, now you can flexibly set a “schedule” on any visual story, once set Columns will automatically update the visual story in sync with your data on a schedule.
How to set it up?
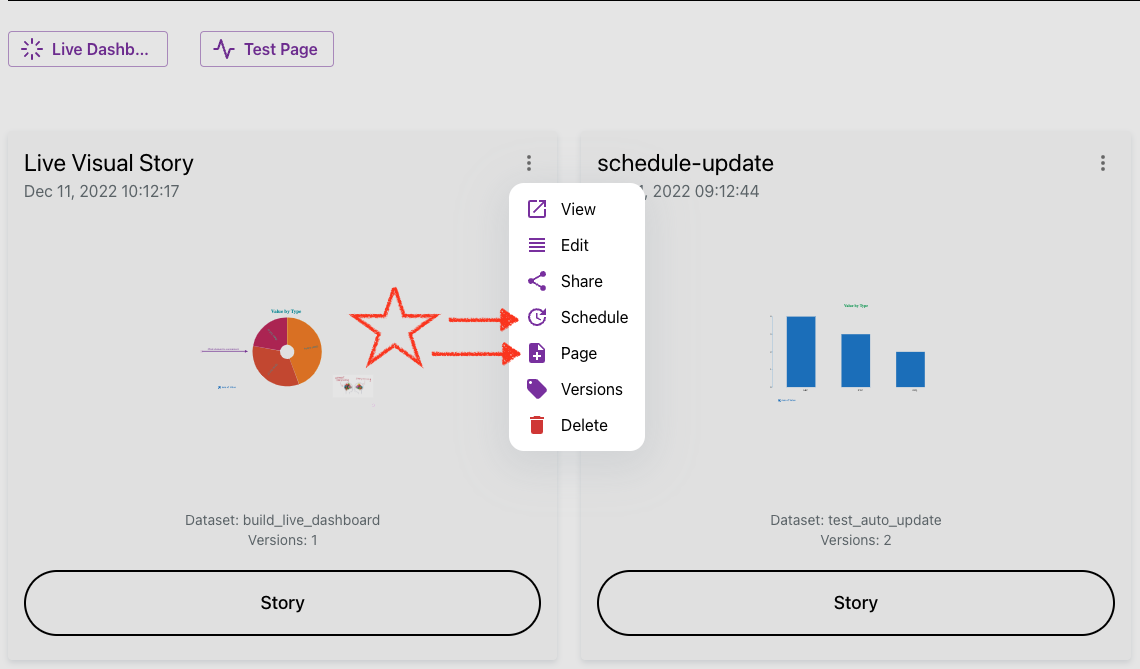
It’s simply just these two options in the visual story menu:
- Schedule
- Page

We hope this is helpful for you as well as those who have asked! Here is the document page for the live dashboard feature.
Again, we love to hear your feedback, by any way listed on the contact page.
