Bar Race
Bar race is a common annimated visualization where it shows key field changes with a ranking position. Columns bring a bar race visualization for us to easily create and configure an animated visualization.
Requirement
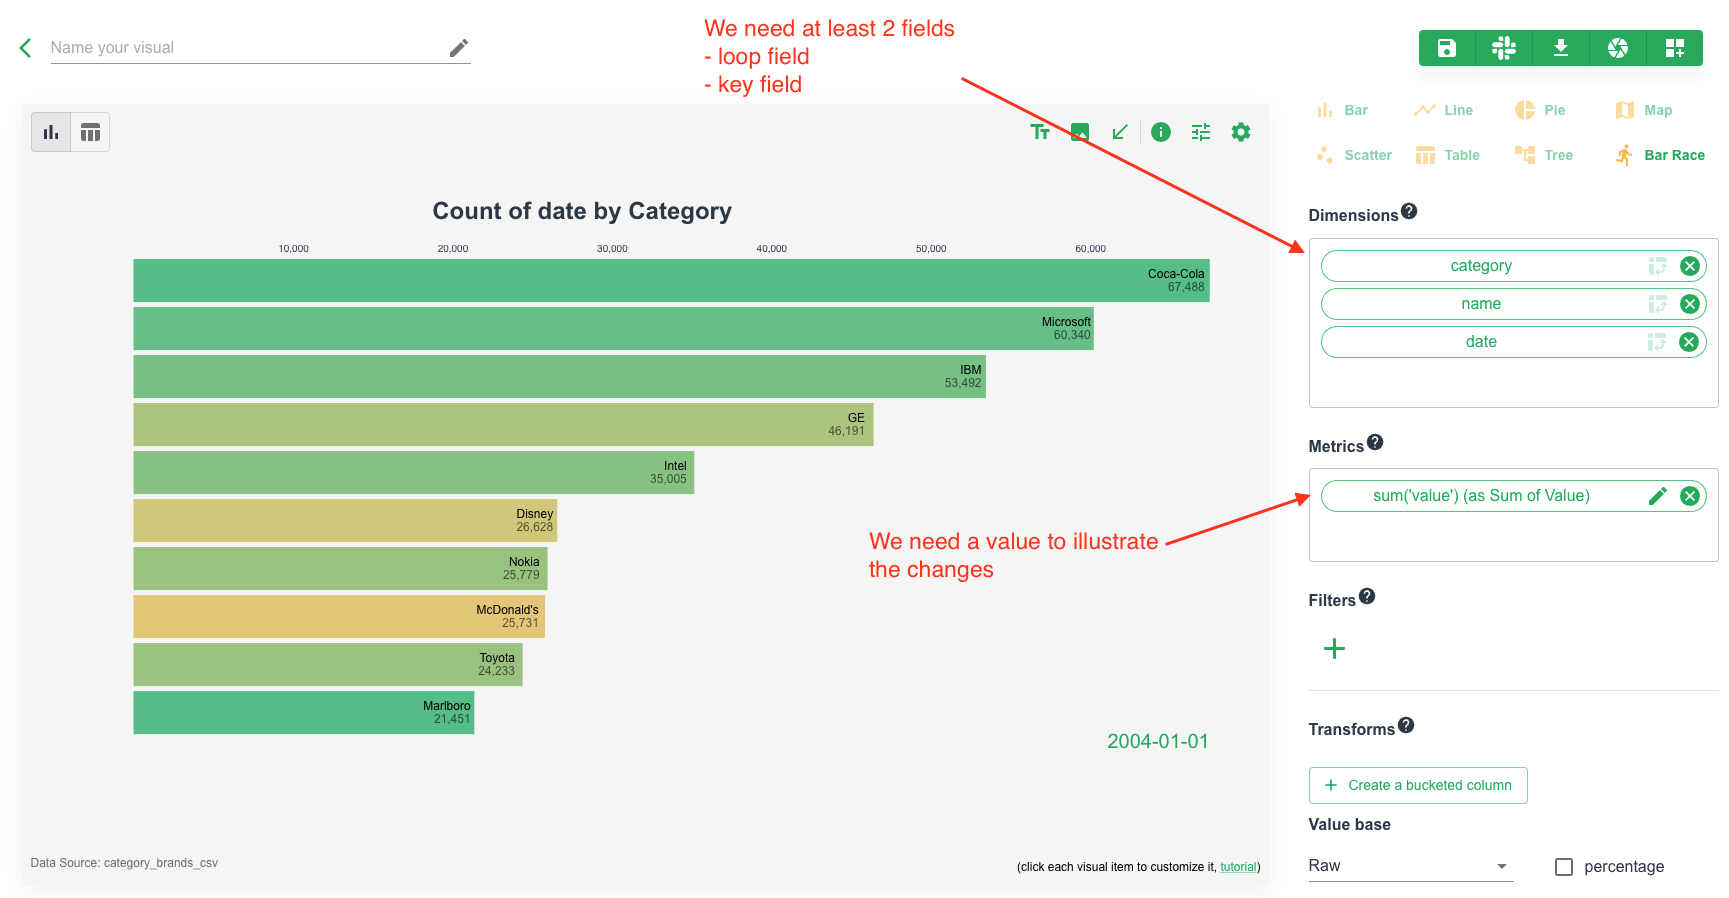
To create a bar race, we need at least two fields in query dimensions:
- loop field: the field that we loop visual frames over.
- key field: the field that we examine data values from.
Like normal, we need one single value in query metrics, it's usually the value associated with the key.
By default, Columns will use the customized or the default palette to assign color to each key. But we can also specify a field for color, sometimes it's the category of each given key.
Bar Race Visual Anatomy
Let's take a look at an example to explain how it works
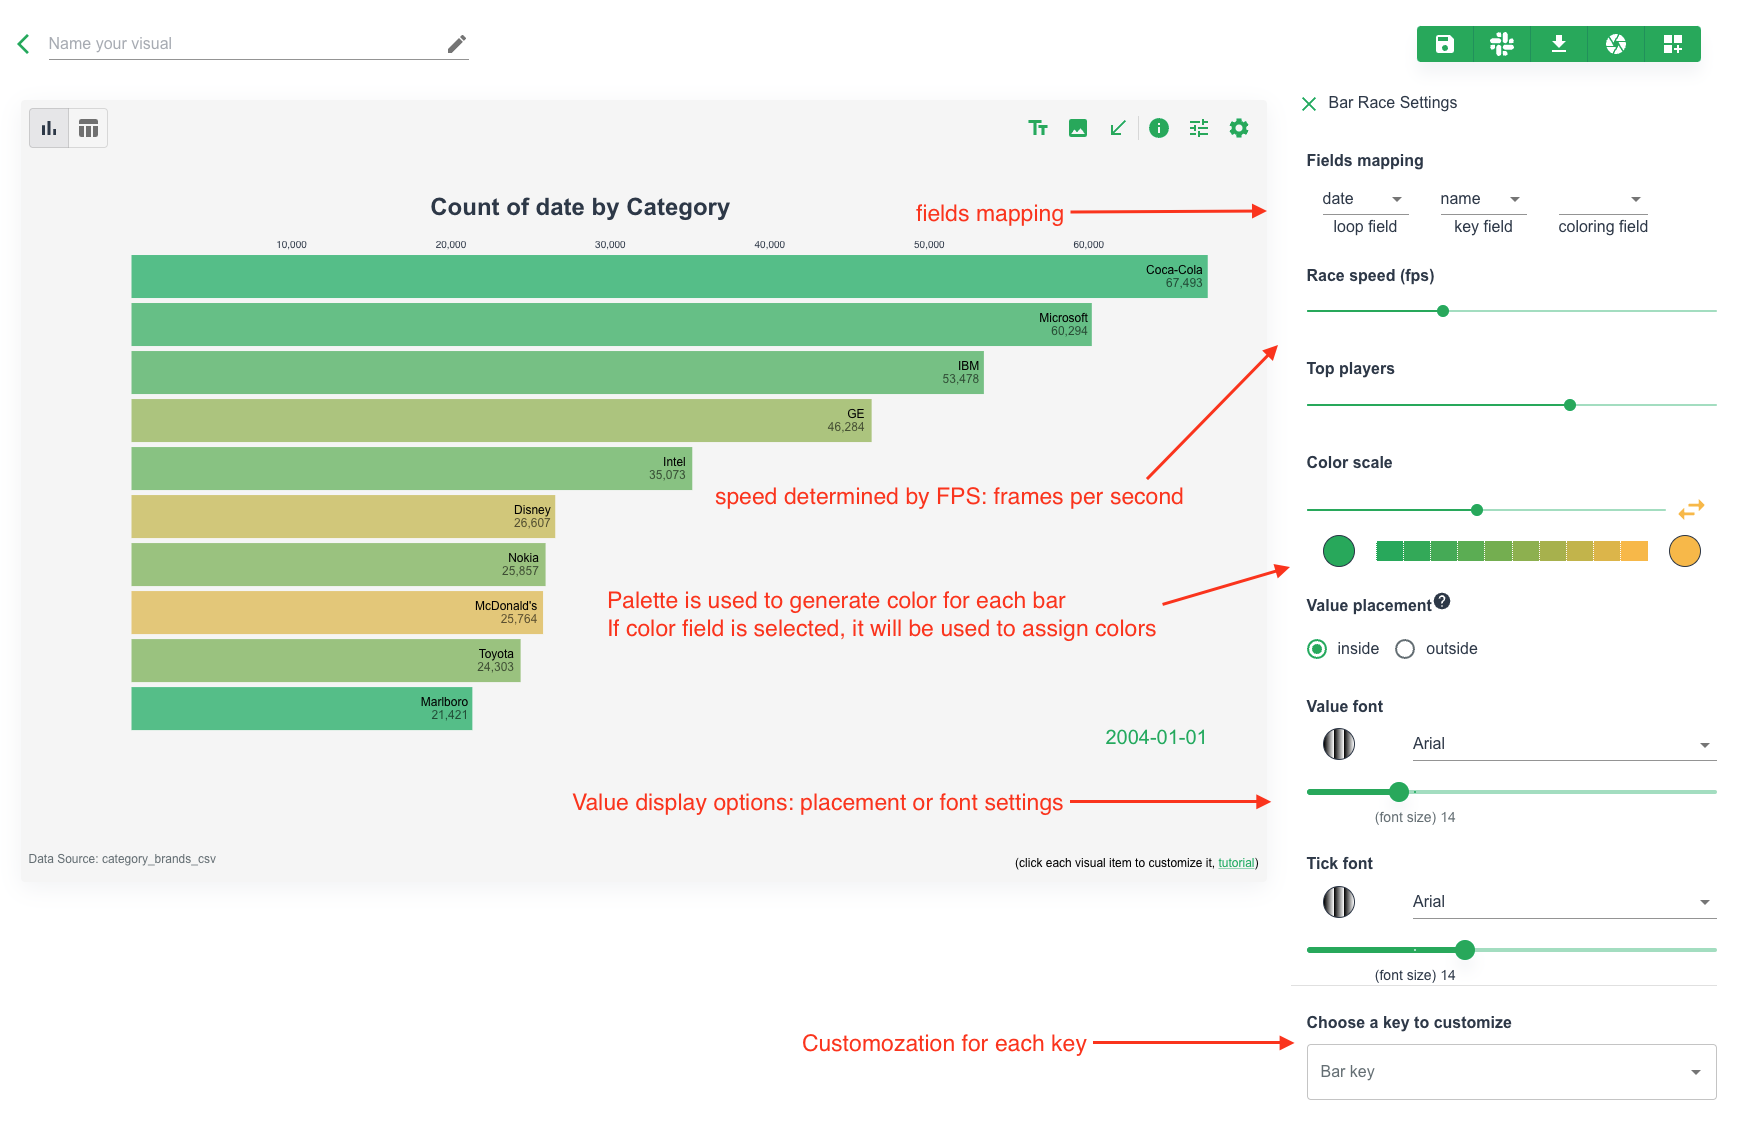
By clicking any element in the graph, it brings the settings for bar race, from this panel, we can
- configure all relevant fields for the visual: loop field, key field, and an optional color field.
- animation related settings - speed and number of players to show
- value display properties
- single key customization, such as use different color for a specific bar
Look up logo
Columns has a repo for entities including objects like companies or countries. If your bar race happens to have keys connecting to those entities, Columns can look up those entities for LOGO display.
Entities are updatable. Visit this link to look up, create or update.